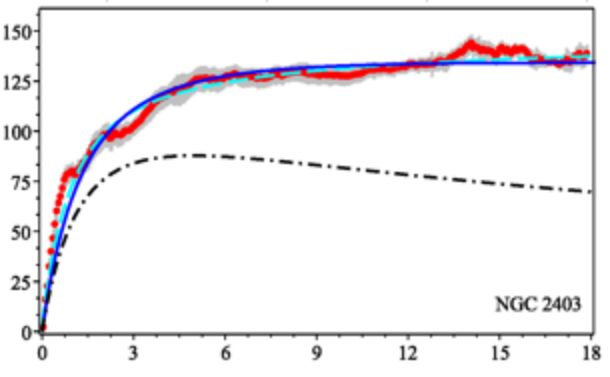
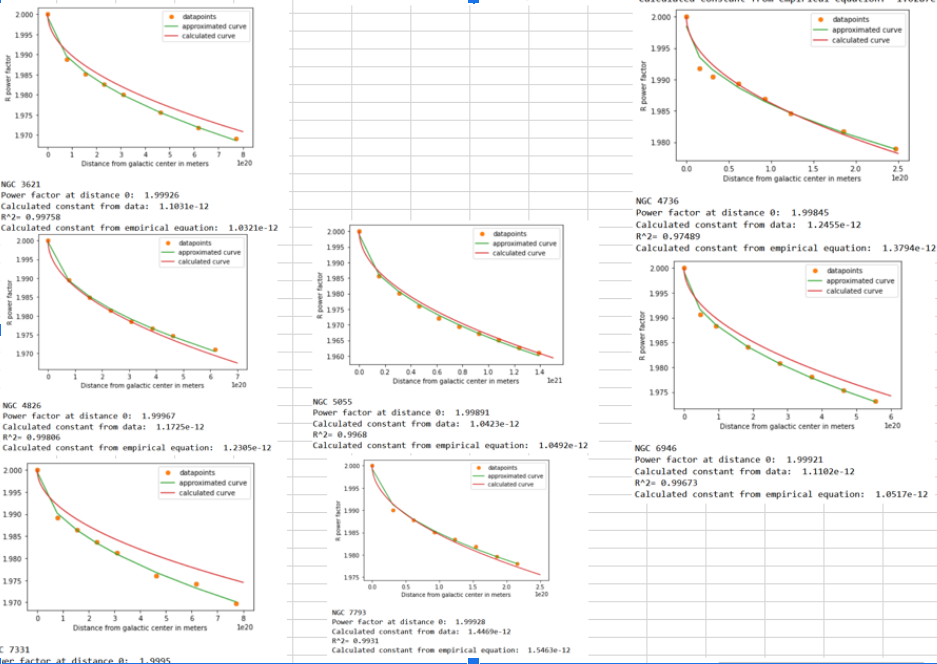
Last winter I started toying with the galaxy gravitational rotation curve graphs. I started modifying the exponent of $r$ that in effect change the $1/r^2$ law and therefore correct the mismatch, just to see where it will lead me.
Using Newtons law of gravity and centrifugal force equation I was able to find the constant GM (representing the interior mass for that distance) for a certain radius and then solve the reverse task of what the approximate power of r should be in the inverse gravitational law for a certain distance to align the gravitational equation with observation.
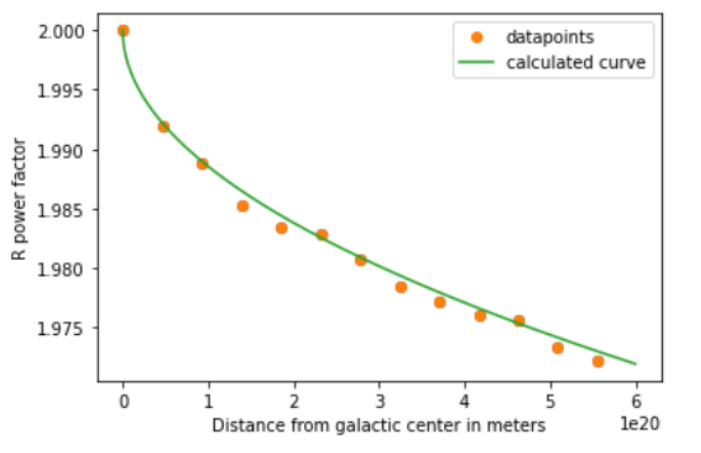
There are several limitations while trying to fit different functions that adhere to physical phenomena. The power must equal 2 for distance 0 to achieve spherical symmetry, and furthermore should be limited by value 1 since this corresponds to a planar symmetry. After trying exponent functions (that violate the first principle) and log functions (indeterminate at 0) I came up with the form $r^{2-C \sqrt{r}}$. This violates the second principle but since the effect should be local and limited to the galaxy, it works as the first approximation. Fitting the function I get the graph
Repeating this procedure for a multitude of galaxies I got a larger database, with which to ascertain the constant in the equation. Thinking that the more important and readily available data for galaxies is mass and radius I redefined the constant to be $C_1 r^\alpha m^\beta = C$. This pushed the constant definition just further but hopefully gives an accurate enough model of calculations.
Using galaxies NGC3521, NGC 5055 and NGC 4736, NGC4826 that have similar radius to define the power of the mass dependence (came out as 0.027 and 0.022, averaged 0.025) and doing the same with NGC 7793, NGC 2976 and NGC 7331, NGC6946 to get two estimates for radius (-0.5778, -0.40694 averaged to -0.5). The weak relation of mass seems insignificant but with galaxies of equal radii, mass has always an increasing effect on the constant, weak as it is.
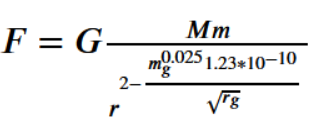
After knowing the constants alpha and beta we can use a statistical average to get the approximate constant C_1 for our datagroup giving us the empirical relation
Where r is the distance from the galactic center in meters, $r_g$ is the radius of the entire galaxy in lightyears and $m_g$ is the mass of the galaxy in solar masses.
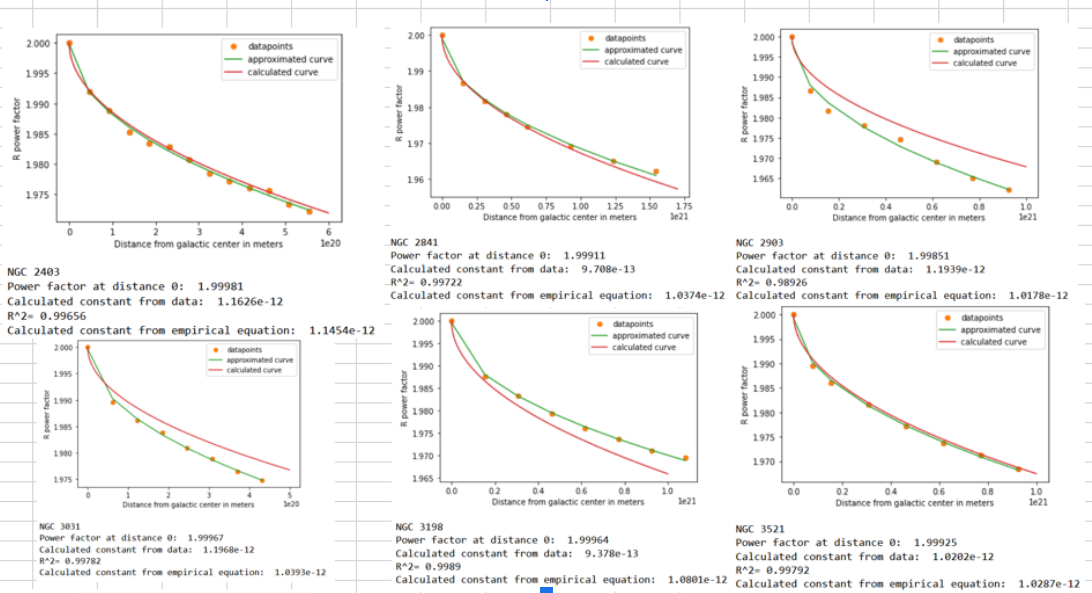
Using this function to backwards plot the exponent equation we get a collection of all other graphs confirming the general fit of the model (atleast with the calculated constant from data, not empirical model).
The above relation should be a somewhat good empirical equation on its own. Probably the constant (if it even has a functional relationship to reality) is still varied by other possible parameters.
Is this something that is known or have I just been dealing with numerology? While I am studying physics, I am in a completely different area with no aquaintances in the relevant field. Perhaps it will just have been an interesting 5 minute read.

