2
$\begingroup$

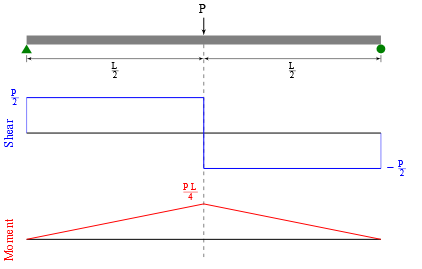
I've read a fair amount of material on the physics of elasticity. That mostly covers the states of stress and strain and their relationship at a point. I don't recall ever encountering the so-called shear and bending momentum diagram used in engineering. For example https://en.wikipedia.org/wiki/Shear_and_moment_diagram

Since there have been a few stable structures produced by engineers over the past century or so, I will assume the method gives meaningful results. But it seems a bit artificial. The abrupt transitions in the graphs are not typical of actual physical systems. At the differential level, the stress tensor field of a homogeneous continuous elastic material will vary continuously from point to point.

Is there a standard way of relating the shear and bending moment diagram to the tensor field describing the state of stress at points in a material? I'm interested in a simple plane deformation case of the kind shown in the first diagram of the Wikipedia article.

Of particular interest would be the orientations of the principal axes at different points in the stressed member.

enter image description here

$\endgroup$
0

2 Answers 2

2
$\begingroup$

You've intersected with the standard approach with which engineering students learn about stress and strain in college. The framework is covered in Beer & Johnston's Mechanics of Materials, for one, among several other standard textbooks on the so-called mechanics of deformable materials. Since you're well accustomed to self-education, I'll just provide some pointers to where to look for more information.

The abrupt transitions in the graphs are not typical of actual physical systems. At the differential level, the stress tensor field of a homogeneous continuous elastic material will vary continuously from point to point.

An important principle is Saint-Venant's principle which says that the distribution of a particular load becomes less important with increasing distance from the load. Put another way, far from a load (say, three times the beam thickness), it doesn't matter whether the load is applied at a point or over a finite region. In addition, the assumption of a point load actually provides a factor of safety because certain measures—such as the bending moment—peak at a point rather than a slightly less impactful curve. Engineers love conservative assumptions.

Is there a standard way of relating the shear and bending moment diagram to the tensor field describing the state of stress at points in a material?

Yes; you simply superpose the normal stress resulting from the bending moment with the shear stress. At the top of the beam, for example:

$$\sigma=\left[\begin{array}{ccc} \dfrac{Mt}{2I} & \dfrac{S}{A} & 0\\ \dfrac{S}{A} & 0 & 0\\0 & 0 & 0\\ \end{array}\right],$$

where $M$ is the bending moment at that horizontal position, $t/2$ is the distance from the neutral axis (here, assumed to be simply half the height $t$ of the simple beam), $I$ is the second moment of area of the beam (also called the moment of inertia) for that bending mode, $S$ is the shear, and $A$ is the cross-sectional area. Hopefully this emphasizes the importance of calculating the shear $S$ and bending moment $M$, often through graphical diagrams in introductory classes.

As always, the principal axes can be found through solving the eigenvalue problem or from using the graphical technique of Mohr's circle.

This is just a sketch of an answer; please let me know if this is what you're broadly looking for and what remains unclear.

$\endgroup$
1
  • $\begingroup$ I will need to return to this in my next (2 to 3 month long) review cycle. It's probably not prohibitively difficult to sort out. I was just hoping to find a nice graphical depiction that I wouldn't have to work too hard to figure out. So, perhaps I'm being lazy. $\endgroup$ Commented May 21, 2021 at 5:04
1
$\begingroup$

In addition to what chem-mechanics said, I would add the following:

The Strength of Mechanics approach (aka mechanics of materials approach) makes some educated guesses about the kinematics of the deformation, and, based on these, is able to determine all the stresses, forces, and deformations involved. For beam bending, it is assumed that all cross sections remain flat and perpendicular to the displaced centerline (neutral axis) of the beam. As such, for the case in your figure, the bottom half of the beam is under axial tension and the upper half of the beam is in axial compression. The state of axial strain along the beam is expressed as $\epsilon_{xx}=-\epsilon_0\frac{y}{h}$ where h is half the thickness of the beam, and y is the distance above the centerline (neutral axis), where $\epsilon_0$ is the axial strain at the bottom of the cross section, and equal to h/R, where R is the local radius of curvature of the beam in the x-y plane. So the strain is distributed linearly on the cross section. Based on this kinematics, the xx stress along the beam is $$\sigma_{xx}=\epsilon E=-\epsilon_0 E\frac{y}{h}$$where E is Young's modulus. The stresses in the y- and z-directions are taken to be zero. $$\sigma_{yy}=\sigma_{zz}=\sigma_{yz}=0$$The shear stress on a plane of constant x is zero at y = +h and y = -h, but integrates to the shear force Q over the cross section. So it is assumed to be $$\sigma_{xy}=\sigma^{0}_{xy}\left[1-\left(\frac{y}{h}\right)^2\right]$$ This is pretty much the simple stress and strain distribution assumed to exist at each cross section. Theory of elasticity solutions to beam behavior are found to pretty much confirm these descriptions, and, based on this simple model, beams have been designed and validated for hundreds of years.

$\endgroup$

Your Answer

By clicking “Post Your Answer”, you agree to our terms of service and acknowledge you have read our privacy policy.

Not the answer you're looking for? Browse other questions tagged or ask your own question.