1
$\begingroup$

I am studying Thermodynamics in my first year and I don't quite understand the process of isothermal reversible/irreversible expansion. Below is a P-V graph I found on Google, just to help me illustrate my question here.

enter image description here

My question is: why does the irreversible process take the path under the curve (the red route)? Why can't it take the path above the curve (the blue route)? I tried to figure out why this is not happening. For a process to be spontaneous, the overall entropy (system and surrounding) should be positive. But I couldn't see how entropy comes anywhere in this graph. Please shed some light on this.

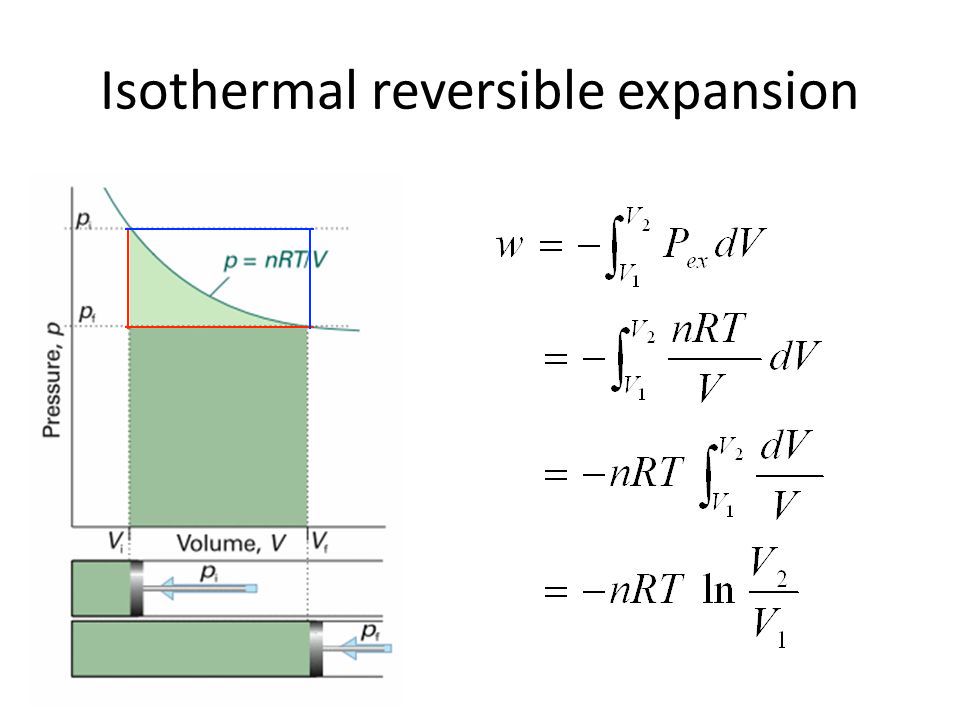
$\endgroup$
3
  • 1
    $\begingroup$ What do you get if you do a force balance on the massless piston during the irreversible deformation? $\endgroup$ Commented May 3, 2020 at 12:13
  • $\begingroup$ Thermodynamics is confusing!! Please help me!! $\endgroup$
    – user279106
    Commented Dec 31, 2021 at 14:08
  • $\begingroup$ The image is taken from slideplayer.com/amp/10212156 Please go through this slide player. It was very helpful. $\endgroup$
    – user279106
    Commented Dec 31, 2021 at 15:05

2 Answers 2

2
$\begingroup$

It does not take the red curve, nor the blue. It does not take any curve on that graph.

The P-V graph you show is a phase diagram. Each point represents a equilibrium state of the system. In reversible expansion, the system is at each time at equilibrium. Then, you can draw its trajectory on the graph. However, in irreversible expansion the system goes out of equilibrium. In this case, there is no trajectory that you can draw on a phase diagram! You can only draw the initial and final points.

$\endgroup$
13
  • 1
    $\begingroup$ Interesting idea, but I found on my text book: Thermodynamics and statistical mechanics by John M. Seddon, it represents the irreversible path with the red route and explicitly says "the irreversible process is carried out by suddenly lowering the pressure" $\endgroup$ Commented May 4, 2020 at 8:43
  • $\begingroup$ I found that passage and I find it misleading, at best. I guess you refer to Fig. 2.7 Chapter 2, pag. 10. Notice that in the book the y axis is p_ex. Then yes, if you keep volume constant and change p_ex you are going on that path. But this is not the P-V diagram of the system! $\endgroup$
    – fra_pero
    Commented May 4, 2020 at 9:24
  • $\begingroup$ Notice also that there can be indeed reversible processes that trace the red and blue curve in your graph. These are called isochoric and isobaric processes. These ones are reversible and can be drawn on the P-V diagram. $\endgroup$
    – fra_pero
    Commented May 4, 2020 at 9:29
  • $\begingroup$ According to text books,the reversible follows the green line curve.Red & blue processes Pi ->Vf are irreversible.This is because in these processes you must give and take heat from the gas. – elias2010 8 mins ago Edit Delete $\endgroup$
    – elias2010
    Commented May 4, 2020 at 11:47
  • $\begingroup$ @elias2010 This is wrong. Please have a look at the links in my other comment. Moreover, also in the isothermal reversible expansion there is heat exchange. No heat exchange is in a adiabatic process. These are different concepts. $\endgroup$
    – fra_pero
    Commented May 4, 2020 at 12:30
0
$\begingroup$

In isothermal process holds: ΔQ = ΔW = nRTln(Vf/Vi) = nRTln(Pi/Pf). The change of entropy ΔS depends only on initial and final points: ΔS = ΔQ/T = nRln(Vf/Vi) = nRln(Pi/Pf)

$\endgroup$

Your Answer

By clicking “Post Your Answer”, you agree to our terms of service and acknowledge you have read our privacy policy.

Not the answer you're looking for? Browse other questions tagged or ask your own question.