0
$\begingroup$

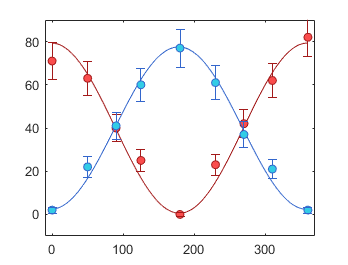
I have a set of data. I want to fit it to a sine function of the form : \begin{equation} f(x)=A sin(\omega x+B)+C \end{equation} I use the least-square method to find the appropriate fit-parameters which are $A$, $B$ and $C$. In this method, each term of the cost-function has a weight calculated from the error-bar of each point in my dataset (see the figure, where each data point has a different error-bar). It gives me this kind of fit (I have two fitted curves for 2 different sets of data actually):

enter image description here

Now I want to calculate the visibility $V$ for, let's say, the red curve. The visibility is defined by : \begin{equation} V=\frac{f_{max}-f_{min}}{f_{max}+f_{min}} \end{equation}

I obtain a good value of $V=0.95$, but now I want to know how to calculate $\Delta V$, the error of the visibility.

Do you know how to do it ?

$\endgroup$
5
  • $\begingroup$ Is $V$ just $A/C$ ? $\endgroup$
    – ProfRob
    Commented Jun 3, 2019 at 13:57
  • $\begingroup$ Yes it is, but nonetheless I am looking for its error, basically I need errors of A and C $\endgroup$ Commented Jun 3, 2019 at 14:36
  • $\begingroup$ The visisbility $V=V(f_{max},f_{min})$, you take the absolute differential of $V$ and then apply error propagation. The errors of $f_{max,min}$ should be obtained from the fit. $\endgroup$ Commented Jun 3, 2019 at 14:39
  • $\begingroup$ How to obtain the errors for $f_{max,min}$ ? or $A, C$ ? I guess this is more my question in fact $\endgroup$ Commented Jun 3, 2019 at 14:43
  • $\begingroup$ Would Cross Validated be a better home for this question? $\endgroup$
    – Qmechanic
    Commented Jun 3, 2019 at 15:52

2 Answers 2

1
$\begingroup$

I mostly agree with Rob Jeffries but I would add something. I too would recommend Numerical Recipes (Press et al) for this. One of the points mentioned by those authors is that one should not just apply standard statistical formulae unless you have good reason to think that they apply---and they usually do not!

There are three main methods, as follows.

  1. Applying some standard statistical formulae (such as covariance matrix). A lot of people do this with their data, but it is questionable. Here you first have to make the assumption that the experimental statistical noise at each datapoint follows some known behaviour, such as the normal (or Gaussian) distribution. You also have to assume that your fitted curve has the right functional form and there is no systematic error. If these assumptions hold then you can use various standard formula involving weighted sums of residuals, which I will not provide here since I would not recommend this approach, because in practice it is very rare that noise in experiments follows the assumptions made in such models.

  2. A good method is simply to change the values of the parameters in the fit until the fit no longer looks "good"---that is, until the residuals show some non-negligible departure from randomness. Your example looks simple enough for this to be a good approach, and arguably better than method 1.

  3. A very good method is the "bootstrap" method. Here you repeatedly fit the same set of data, but each time randomly selecting $N$ items from your $N$ data, such that in each test you use only some of the data, and some of the points get repeated. You thus accumulate a whole set of fitted parameter values. This set has a spread which gives a good indication of the accuracy of your best fit values.

There's some further info here:

https://ned.ipac.caltech.edu/level5/Wall2/Wal3_5.html

I guess there will be other places which explain it more fully.

$\endgroup$
0
$\begingroup$

I think that your $V$ is just $A/C$. So what you need to do is to express $f(x)$ in terms of the parameters you are actually interested in. e.g. $$ f(x) = A \left( \sin(\omega x + B) + \frac{1}{V} \right), $$ or $$ f(x) = C\left( V \sin(\omega x + B) + 1 \right), $$ and fit one of these functions using your least squares approach.

Neither is going to be perfect, or at least the uncertainties are not going to be perfect, because there will be some correlation between the parameter uncertainties.

EDIT: Your comments reveal that you don't know how to find any of the uncertainties. This is a standard text-book bit of statistics. The goal is to find where in the chi-squared space, the value of chi-squared increases by some threshold amount. I would recommend reading section 15.6 of Numerical Recipes by Press et al.

For example if you want 68% confidence intervals on all 3 parameters then you need to look along each parameter axis for where chi-squared increases by 3.53. If on the other hand you are only interested in $V$ then you look for values of $V$ that increase the chi-squared by 1 from its minimum value.

Note that most least-squares-fitters will also return the "covariance matrix" and the leading diagonal elements of this matrix are often used (very roughly) as the square of the 68% confidence error bar. I say roughly, because if the uncertainties are non-normal or if there is any dependence of one parameter on another (which there certainly is when you introduce $V$) then this approximation breaks down. Note that the above consideration is also why you cannot use the uncertainties in $A$ and $C$ to calculate errors in $V$ by standard error propagation formulae.

If uncertainties are really important to you then you probably need to do a Monte-Carlo simulation and adopt a Bayesian approach to estimating the posterior probability functions for the parameters. That is beyond the scope of a simple Physics SE answer.

$\endgroup$
3
  • $\begingroup$ Thank you for your answer, but in fact I am not sure how to get the uncertainties for any fit parameters. A, B or C or V. $\endgroup$ Commented Jun 3, 2019 at 14:38
  • $\begingroup$ How did you calculate A B and C from your data? $\endgroup$
    – The Photon
    Commented Jun 3, 2019 at 14:50
  • $\begingroup$ I looked for the minimum of the function $\chi(A,B,C)=\sum_{i=1}^{N} \left( \frac{ y_{i,x} - f(A,B,C,x)}{ \sigma_{i}} \right)^{2} $ with $N$ the total number of datapoints, $x$ it's position along the $x$ axis and $y$ its value. $\sigma_{i}$ represent the error bar of the i-th datapoint. Finding the minimum of $\chi$ give me good estimates for A,B and C parameters (it's the least-square method) $\endgroup$ Commented Jun 3, 2019 at 15:08

Your Answer

By clicking “Post Your Answer”, you agree to our terms of service and acknowledge you have read our privacy policy.

Not the answer you're looking for? Browse other questions tagged or ask your own question.