6
$\begingroup$

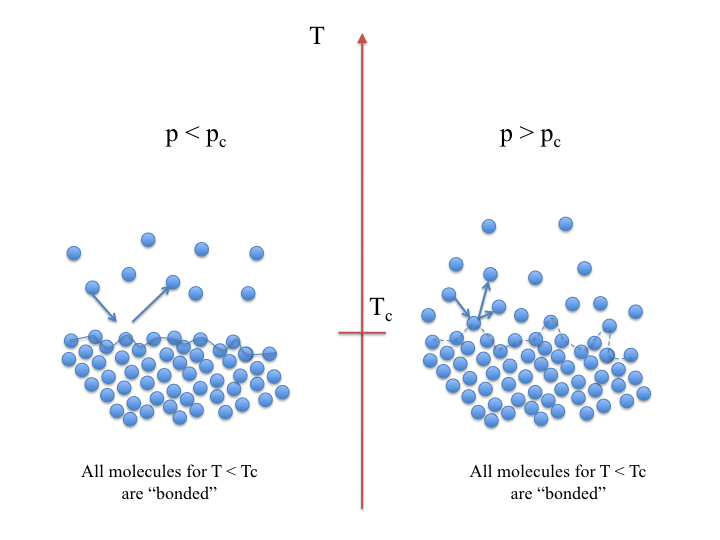
From a molecular point of view, can we think of the super-critical conditions as conditions where T and p are large enough that the collisions of gas molecules are frequent and powerful enough to prevent the molecular bonds that would form a liquid cannot be sustained. So if we consider a single fluid in a constant pressure system and with a temperature gradient from sub-critical temperatures to super-critical temperatures, how accurate is this diagram?

Trans-critical event from a molecular dynamics point of view

How can we represent the disappearance of surface tension on the right side? Are molecules being stripped from the surface by collisions? Because the molecules inside the compressed liquid are still bonded right?

What would you change in this crude diagram to make it more representative of what really happens?

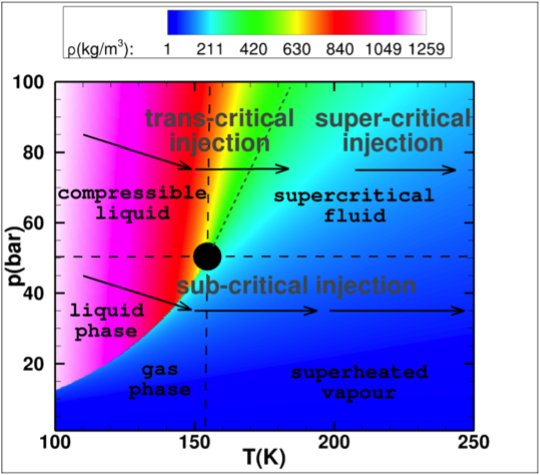
To give a bit more context, I'm more of a fluid mechanics guy modeling inject. So I might not be using the exact terms that I should. The terminology I use is within the context of this diagram:

O2 phase diagram

Phase diagram of oxygen in the $p-T$ space. The black dot represents the critical point at the intersection of the long-dash lines for the critical temperature and pressure. The short-dash line is the pseudo-boiling line (Oschwald_2006a) or Widom line (Simeoni_2010a) and corresponds approximately to the region of maximum specific heat at constant pressure. The density is represented by the colored contours in the background.

$\endgroup$
8
  • $\begingroup$ So no opinion whatsoever on this? Bounty coming up I guess... $\endgroup$ Commented Nov 9, 2012 at 19:45
  • $\begingroup$ Your statement that "... can we think of the super-critical conditions as conditions where T and p are large enough ... to prevent the molecular bonds that would form a liquid ..." This would mean that gas phase is super-critical state, which is not true. Super-critical state is defined as point with p and T both higher than critical conditions. Also I am not sure if it makes sense to try and represent disappearance of surface tension, because it is not something that disappears as soon as the liquid at constant super-critical pressure crosses critical temperature. $\endgroup$
    – mythealias
    Commented Nov 9, 2012 at 20:30
  • $\begingroup$ (I hit the the character limit). There is no well defined surface to speck of as you transition to super-critical conditions. All you can show, in your figure, is changing density from low to high to low as you change temperature at a constant pressure. There are always molecular bonds (interactions) present if the molecules are close enough. $\endgroup$
    – mythealias
    Commented Nov 9, 2012 at 20:31
  • $\begingroup$ So maybe I was not clear but the two drawings (left and right) are meant to illustrate the two paths (upper and lower) on the phase diagram. I'm considering a constant pressure system where I have a spatial temperature gradient. I'm considering a snapshot in time. $\endgroup$ Commented Nov 9, 2012 at 21:01
  • $\begingroup$ And then what I want to understand better is what happens at a molecular level for the macroscopic surface tension to disappear? Is this because the rate/energy of collisions becomes large enough? $\endgroup$ Commented Nov 9, 2012 at 21:03

1 Answer 1

4
+50
$\begingroup$

The point is that when there is only a single phase there is no dividing surface that could hold any surface tension. One has surface tension precisely when a liquid and a gas phase (in general also two liquid phases would be possible) are present simultaneously. This holds only along the coexistence curve in the lower left corner of your phase diagram.

Along your upper path one never meets this line, so one always has a single homgeneous phase without any intrinsic boundary surface. This is also true at almost all points on your lower path - with the exception of the single point where you path meets the coexistence curve.

Upon crossing that point, your liquid starts to boil, and the temperature stalls at the boiling point until the whole liquid is vaporized. During this time, the liquid and gas phase coexist (hence the name coexistence curve), and one has surface tension along any interface surface between the two phases.

Once the boiling point has been passed, there is again only a single gas phase, and no boundary surface exists anymore.

On the molecular level, the statistical arrangement of a fluid in equilibrium has uniform properties at most points of the phase diagram, which usually change continuously with pressure and temperature. Exceptions are precisely the coexistence curves, where there are two (and at a triple point even three) different phases of different density (and hence statistical arrangement) that are thermally equivalent. This means that they carry the same chemical potential and hence can be in equilibrium with each other.

Along such a coexistence curve, one needs a third parameter (the density) to determine the state and the proportions of the fluid that are liquid and gaseous. Upon crossing the coexistence curve while heating (cooling), the proportion of liquid changes from 1 to 0 (from 0 to 1) to cross the discontinuity in structure, and energy is needed (set free) to enable this structural change. Thus again everything happens continuously, though in a less obvious manner.

All this assumes being at equilibrium, i.e., at constant temperature, changed so slowly that equilibrium is maintained throughout the process. (Difficult to in practice; see below.) In case of a temperature gradient, ''a single fluid in a constant pressure system and with a temperature gradient from sub-critical temperatures to super-critical temperature'', the above applies locally in sufficiently small regions each of which may be considered to have constant temperature. Globally, this is a very unstable situation, turbulence will develop, which looks very different from your top diagram. There is no simple dividing surface of the kind you are drawing!

You can see what happens by putting a pot of water on a stove and heating it until it boils. (Hold your diagrams upside down to match it with the experiment.) Standard kitchen pressure is subcritical, but you cann see from your experiment that you won't be able to observe the left hand side of your diagram. Thus there is no reason to expect that at higher pressure you'd observe the right hand side.
$\endgroup$

Your Answer

By clicking “Post Your Answer”, you agree to our terms of service and acknowledge you have read our privacy policy.

Not the answer you're looking for? Browse other questions tagged or ask your own question.