Does anybody get the answer the book gives for this?
Decades ago, I worked through most of the problems in the first part of the original exercise manual for the Feynman Lectures on Physics. It was exceedingly rare that the answer in the book was wrong. I realize that this is a hand-corrected OCR transcription, so it's possible that errors crept in.
Nonetheless past experience tells me that I may be overlooking something subtle (or obvious).
This is Exercise 17.5 in Exercises for the Feynman Lectures on Physics.
Two particles $A$ and $B$ execute harmonic motion of the same amplitude ($10cm$) on the same straight line. For particle $A$, $\omega_{A}=20\text{rad}\text{s}^{-1};$ for $B$, $\omega_{B}=21\text{rad}\text{s}^{-1}.$ If at $t=0$, they both pass through $x=0$ in the positive $x$-direction (hence are then "in phase"),
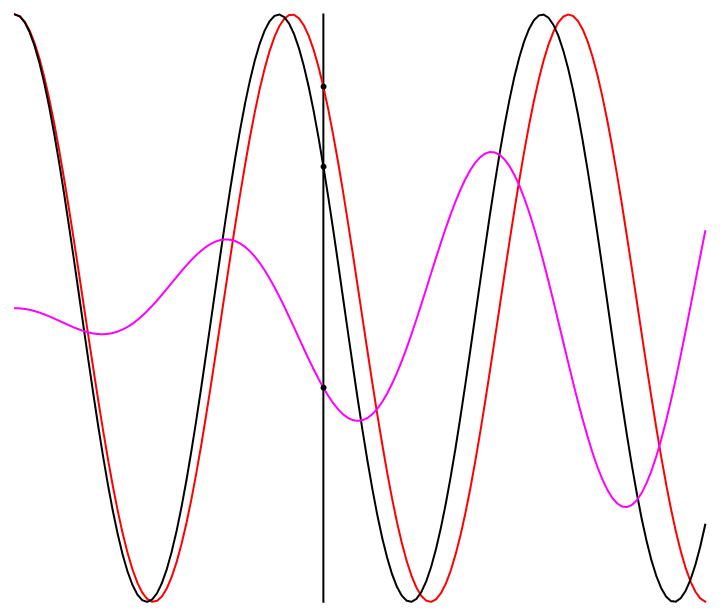
(a) How far apart, $\Delta x,$ will they be at $t=0.350\text{s}?$
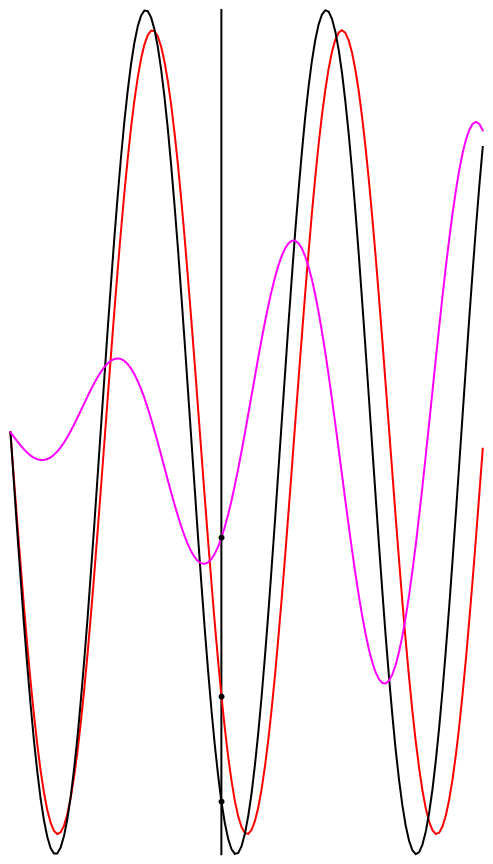
(b) What is the velocity $V$ of $B$ at $t=0.350\text{s}?$
Part (a):
Writing the expressions for position
$x_{A}\left[t\right]=\alpha\cos\left[\omega_{A}t\right]=10\cos\left[20\times0.350\right],$
$x_{B}\left[t\right]=\alpha\cos\left[\omega_{B}t\right]=10\cos\left[21\times0.350\right].$
Calculate the magnitude of their differences
$\Delta x=\left|x_{B}\left[t\right]-x_{A}\left[t\right]\right|=10\left|\cos\left[7.35\right]-\cos\left[7.00\right]\right|$
$\Delta x=2.71\text{cm}.$
The answer in the book is $\Delta x=2.18\text{cm}.$
Part (b):
$V_{A}\left[t\right]=-\alpha\omega_{A}\sin\left[\omega_{A}t\right],$
$V_{B}\left[t\right]=-\alpha\omega_{B}\sin\left[\omega_{B}t\right].$
$V=V_{B}\left[t\right]-V_{A}\left[t\right]=-\alpha\omega_{B}\sin\left[\omega_{B}t\right]-\left(-\alpha\omega_{A}\sin\left[\omega_{A}t\right]\right)$
$=\alpha\left(\omega_{A}\sin\left[\omega_{A}t\right]-\omega_{B}\sin\left[\omega_{B}t\right]\right)$
$V=-52.49\text{cm}\text{s}^{-1}.$
The answer in the book is $V=-49.4\text{cm}\text{s}^{-1}.$
The first attached diagram shows a plot of position versus time. The horizontal line represents $t=0.35$. The magenta curve represents the difference of the positions.
The second graphic depicts the velocities.


