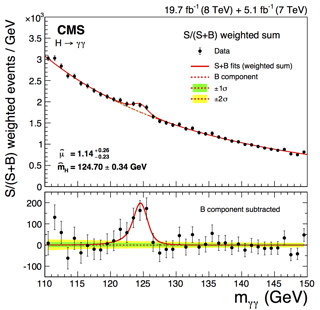
When one has a resonance, particularly one never seen before , one starts by using the data left and right of the resonance as a background extrapolated under the resonance so as to get the experimental significance of the signal. An example is the Higgs discovery:

Combined diphoton mass spectrum illustrating the significance of the observed excess, where events are weighted by the expected signal-to-background ratio. The corresponding background-subtracted distribution is shown in the lower panel.
This is a plot that establishes the existence of a resonance, but cannot be compared to theory because of the measurement errors , the width in this example should be of the order of MeV,not GeV, the experimental errors have to be unfolded.
The use of Monnte Carlo events is necessary to fit the data.
In the Monte Carlo the events are generated according to the theory one wants to fit. Events are generated according to the errors in the various detectors and one can unfold the true shape of the resonance.
It also uses the kinematics of the theory under consideration, according to various parameters of the standard model to be tested .
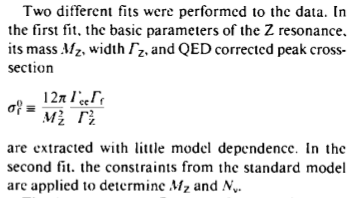
That is the minimal way of fitting the Z (in your question), "little model dependence".
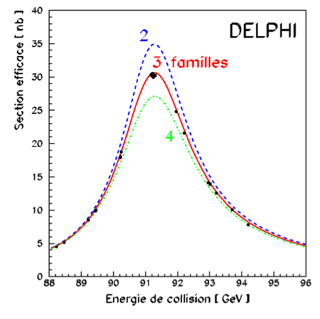
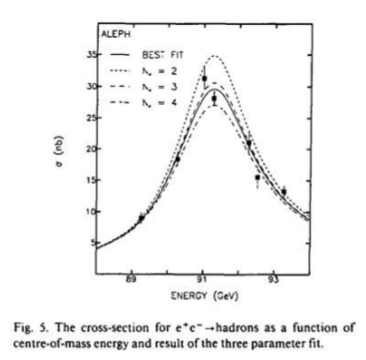
The second method is using two parameter fit with variations of the standard model (3 neutrino species or 4) as a constraint, reducing the number of free parameters, because of wanting to find the dependence on the number of neutrinos, the two free parameters are the mass of the Z and the number of neutrinos. This means at least two different Monte Carlo data sets in the region of the Z.
edit after comment:
This is how the number of neutrinos was determined by trying to fit with open parameters the crossection and the number of neutrinos, using the previously fitted parameters of the standard model except these two.

The black dots are the data, the hashed lines the best fits to the data for each hypothesis.


