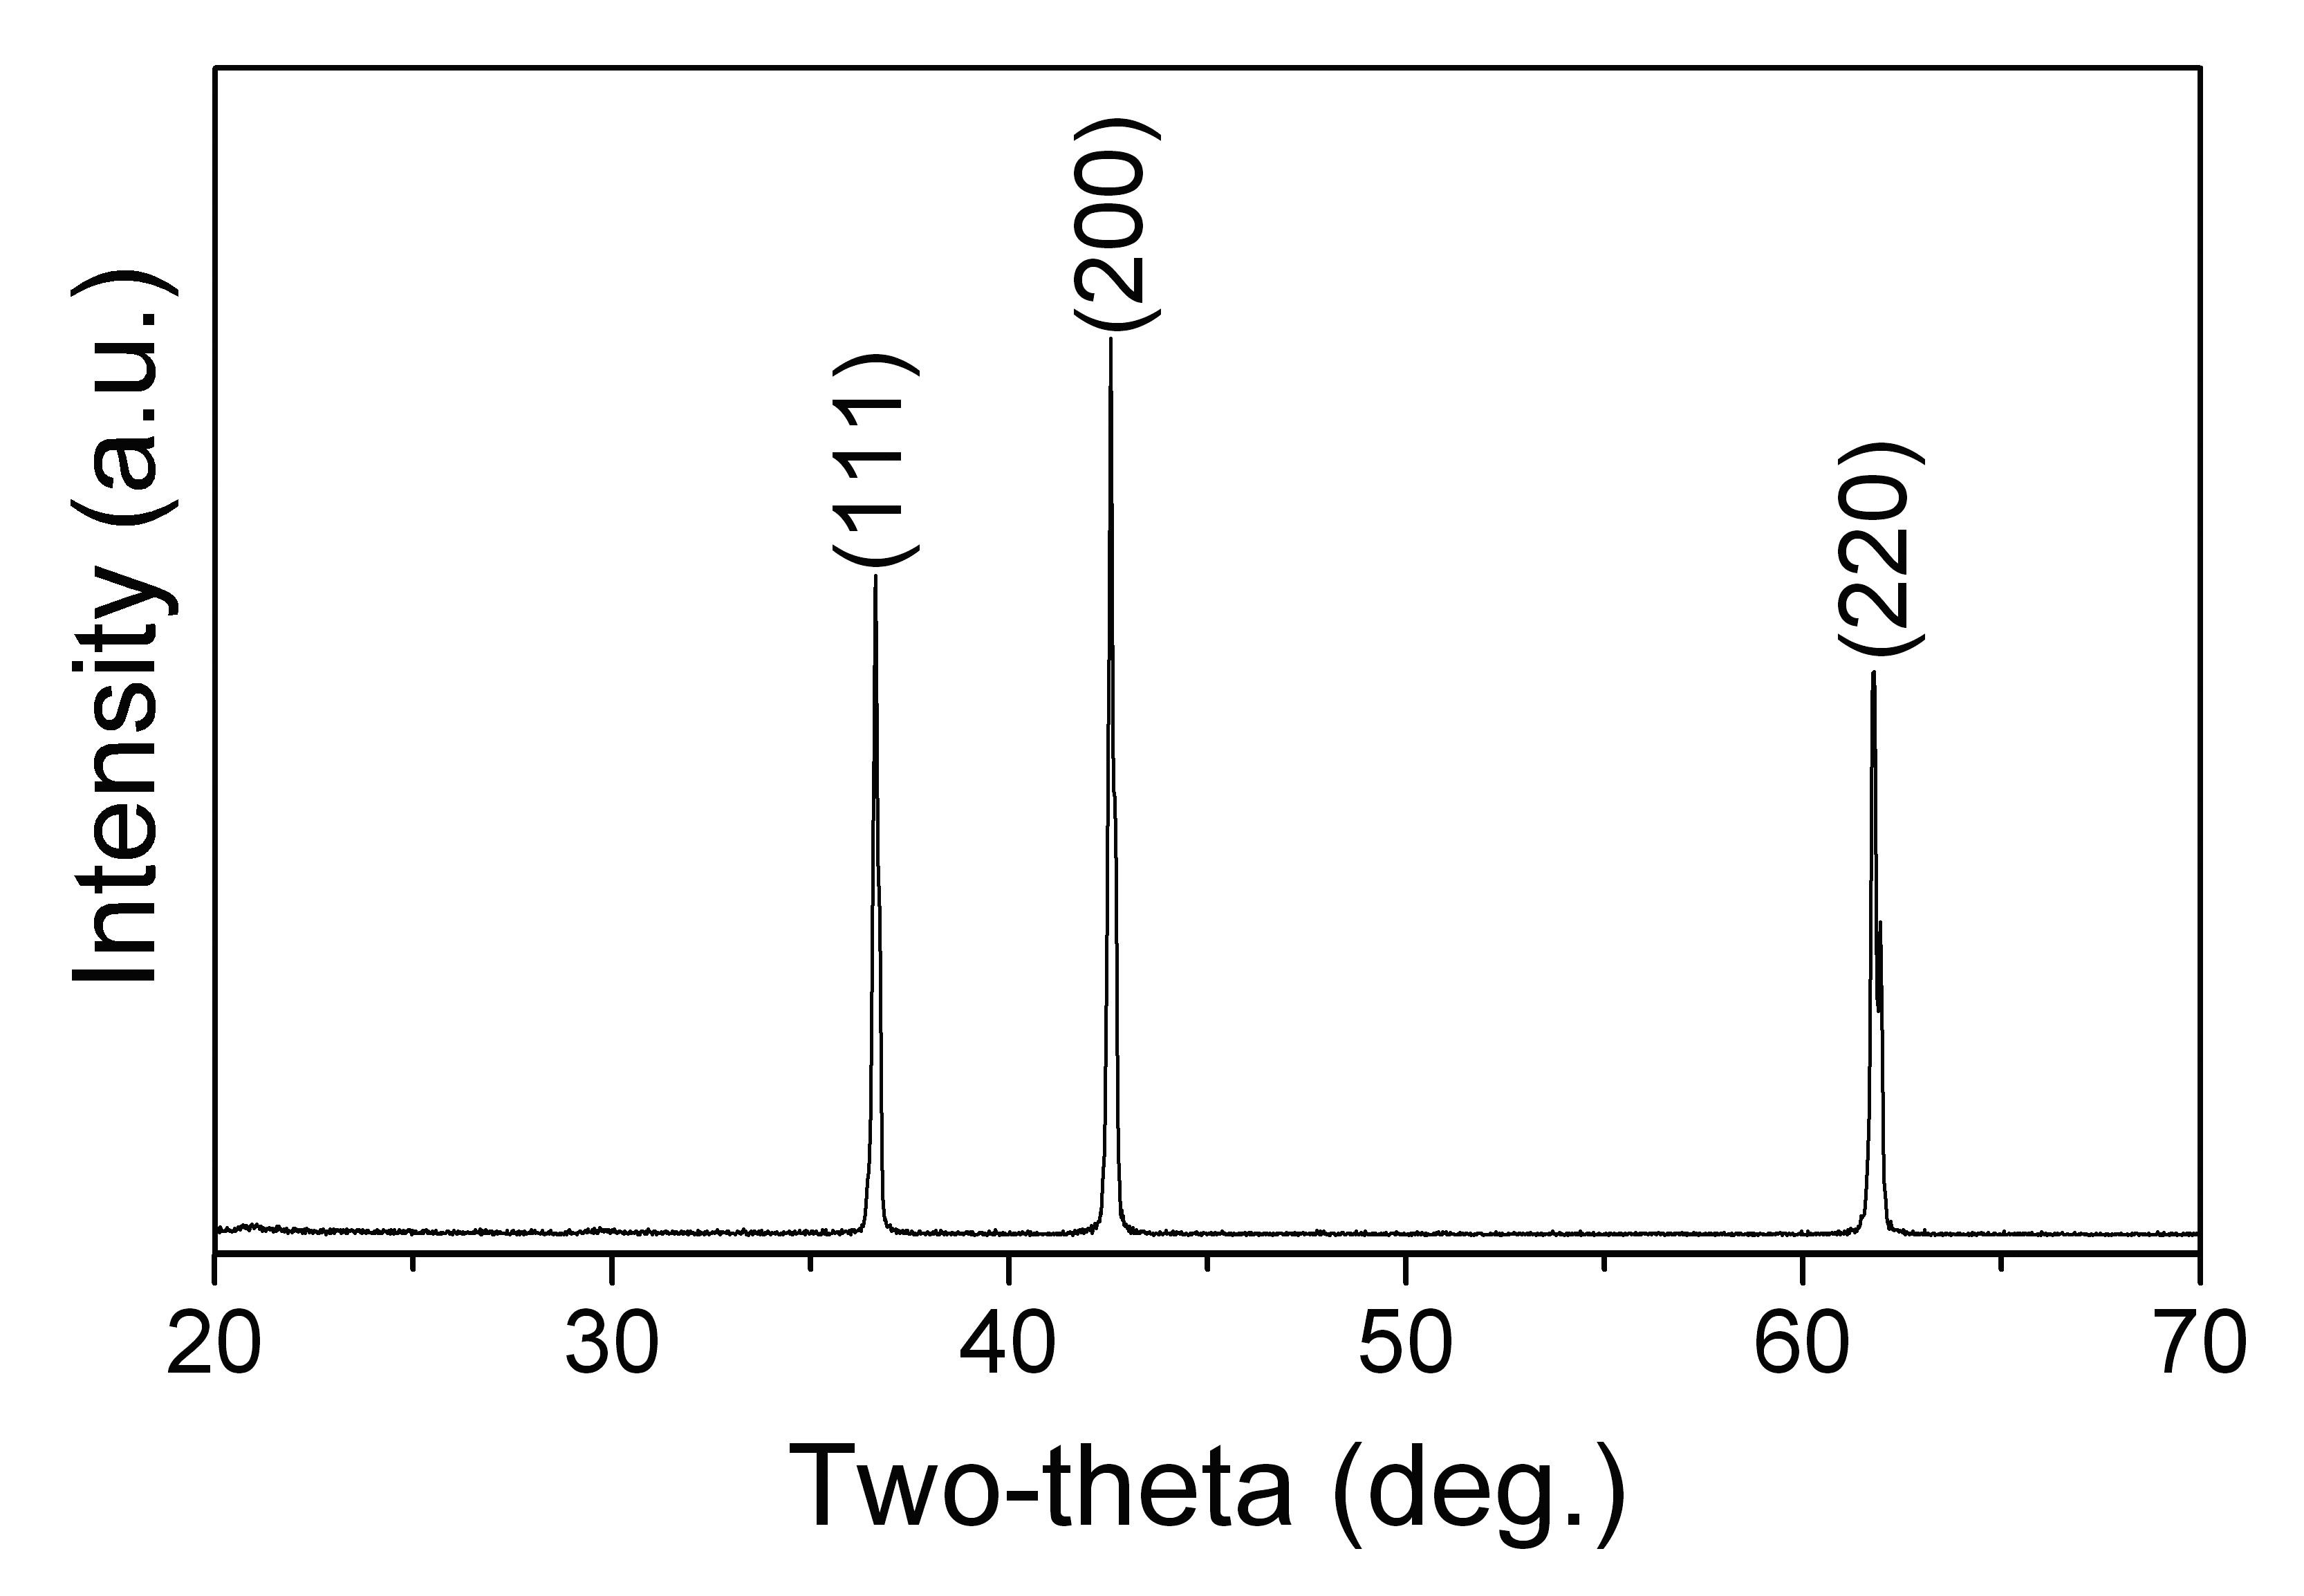
If I have a raw xrd data then how should I convert my peaks arbitray unit intensity to percentage?
In olden days visual intensity scale was used by us in the interpretation of single crystal diffraction data.
As the relative intensities were a requirement the laboratory standards were set on the 'reference' diffraction photographs available say of Laue spots or rotation /oscillation photographs.
In modern times XRD diffractometers data show intensity of the peaks by number of photon counts at different angular positions.
Usually The raw intensity data is measured in counts, corresponding roughly to individual diffraction events.
This data is dependent on the source, the detector, the instrumental design, sample preparation and a host of other factors and so is not useful in itself. So It is common to normalise by the intensity of the largest peak, so that comparisons may be made between measurements collected under different conditions.
In cases where Intensity data is used to measure presence of specific material or phases in a sample -For example in mineral analysis by Powder diffraction pattern /or liquid sample
the ratio of the standard count/intensity and the measured value is taken in calculation.
For more quantitative calculations, it is also possible to include a reference material and scale the intensity by that of one of its peaks.
Profile fitting is the most precise way to determine diffraction peak
position, intensity, and width for calculating lattice parameters and
crystallite size.
Rietveld Refinement:
The Rietveld method is used to refine the crystal structure model of a
material. It can be used for quantitative phase ID, lattice parameter and
crystallite size calculations, and determine atom positions and
occupancies
One can see details :
http://prism.mit.edu/xray/oldsite/Basics%20of%20X-Ray%20Powder%20Diffraction.pdf

