I found this link for the plot.
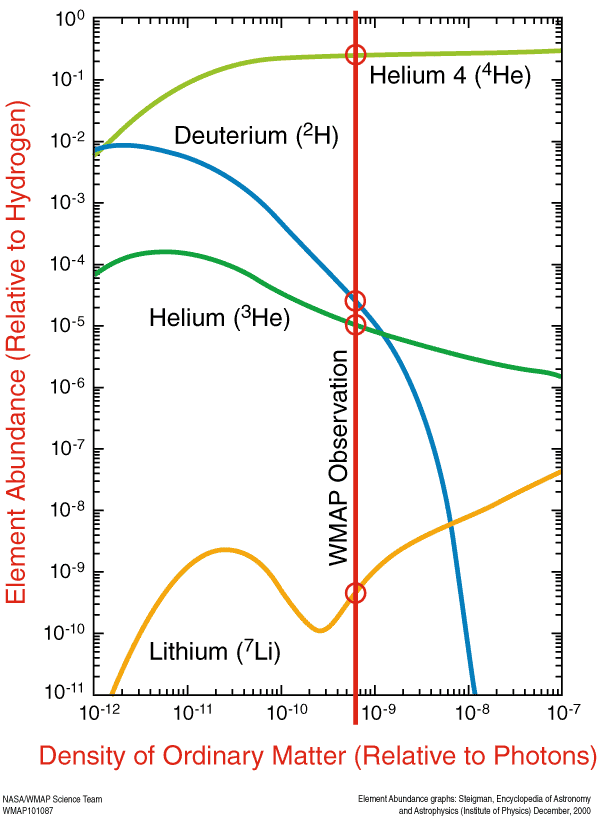
The predicted abundance of deuterium, helium and lithium depends on the density of ordinary matter in the early universe, as shown in the figure at left. These results indicate that the yield of helium is relatively insensitive to the abundance of ordinary matter, above a certain threshold. We generically expect about 24% of the ordinary matter in the universe to be helium produced in the Big Bang. This is in very good agreement with observations and is another major triumph for the Big Bang theory.
However, the Big Bang model can be tested further. Given a precise measurement of the abundance of ordinary matter, the predicted abundances of the other light elements becomes highly constrained. The WMAP satellite is able to directly measure the ordinary matter density and finds a value of 4.6% (±0.2%), indicated by the vertical red line in the graph.
This leads to predicted abundances shown by the circles in the graph, which are in good agreement with observed abundances.
So it is evident that the curves are results of theoretical calculations, validated by satellite measurements at the circles.
Now the answer to "why" becomes "because that is what the theoretical calculation predicts" and it is important that it be tested.
This is an important and detailed test of nucleosynthesis and is further evidence in support of the Big Bang theory. Had the results been in conflict, it would point to 1) errors in the data, 2) an incomplete understanding of the process of Big Bang nucleosynthesis, 3) a misunderstanding of the mechanisms that produce fluctuations in the microwave background radiation, or 4) a more fundamental problem with the Big Bang theory.
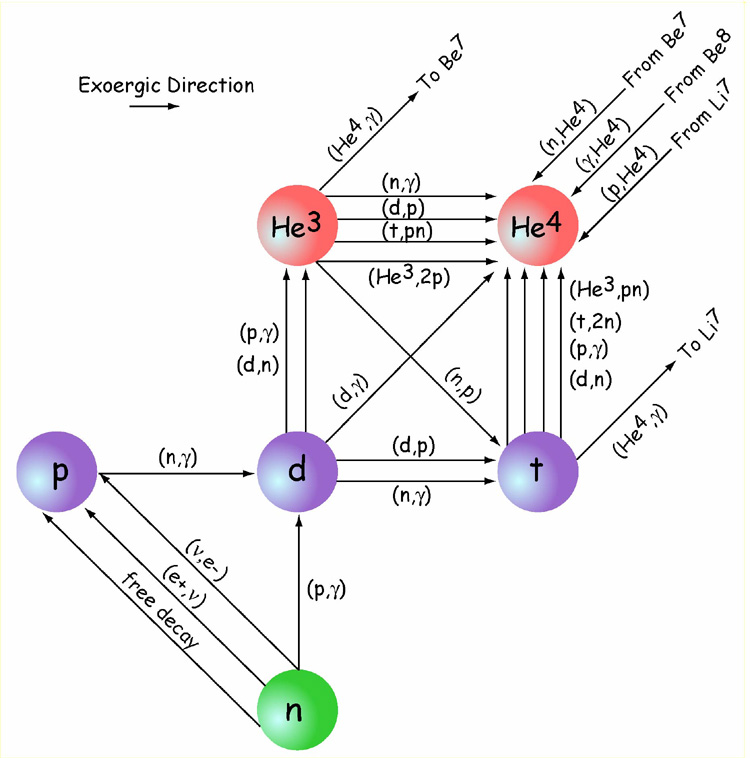
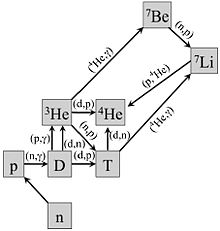
One can hand wave, looking at the way the reactions go :
One second after the Big Bang, the temperature of the universe was roughly 10 billion degrees and was filled with a sea of neutrons, protons, electrons, anti-electrons (positrons), photons and neutrinos. As the universe cooled, the neutrons either decayed into protons and electrons or combined with protons to make deuterium (an isotope of hydrogen). During the first three minutes of the universe, most of the deuterium combined to make helium. Trace amounts of lithium were also produced at this time.
From this plot
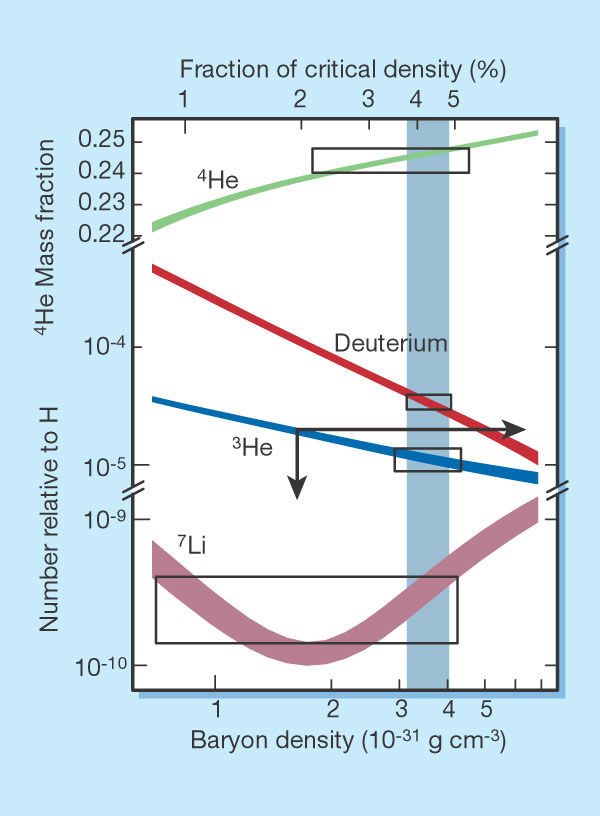
Why do the 3He and D abundances go down with increasing baryon to photon fraction while the Li abundance goes up?
I would guess because protons/neutrons are tied up increasingly into He so less deuterium and Tritium can be fused out of them.
And what is that strange dip in the Li abundance?
We see that Lithium is the end product of either decay of the unstable 7Be or the fusion of tritium with 4He. With competing chains of build up it is not out of the ordinary to see a dip in the 7Li, from the diminishing of one path (tritium, see a) , as helium is constant) while the other takes over( the scale is logarithmic, the slow increase of He4 could do it) .
In any case, one needs to have the exact model to check the individual behaviors.
