0
$\begingroup$

we already know that if we plot speed vs time of free falling object it will be y=gx graph because we know the acceleration is gravity.

If it have air-resistance acceleration will be change right?.

So how we can plot the speed vs time graph of free falling object with air resistance ?

It have some equations or not.

because i want to plot it by using python.

Thanks.

sorry about my english.
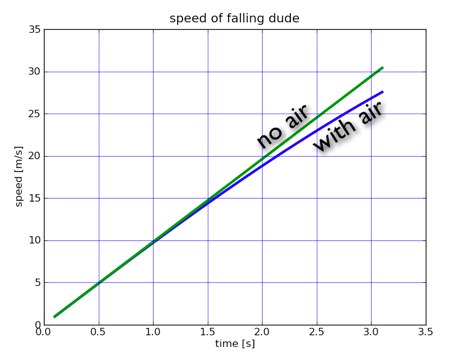
example graph from google

This picture i saw from google but i want to make it by coding

$\endgroup$
1
  • $\begingroup$ Have you tried searching how one models air resistance or air drag? $\endgroup$
    – BMS
    Commented Mar 20, 2014 at 5:01

1 Answer 1

1
$\begingroup$

As you may (or may not) know drag is dependant on the square of velocity.

Have a read for a bit more information: http://en.wikipedia.org/wiki/Drag_%28physics%29

You can see it is also dependant on various properties of the object and the fluid it is travelling through. Changing the "coeff" parameter in the code below will change how the drag is modelled. As requested:

import numpy as np
import matplotlib.pyplot as plt

coeff=0.2

times = np.linspace(0,3.5,100)
tstep = (max(times)-min(times))/len(times)

no_drag_velocities = 9.8*times

a=0
v=0
drag_velocities = []
for i in times:
    drag_velocities.append(v)
    a=9.8-coeff*v**2*tstep
    v=v+a*tstep

plt.plot(times,no_drag_velocities,label="Without Drag") 
plt.plot(times,drag_velocities,label="With Drag")
plt.xlabel("Time [s]")
plt.ylabel("Speed [m/s]")
plt.legend(loc="upper left")
plt.grid()
plt.show()

Drag Plot

$\endgroup$
0

Your Answer

By clicking “Post Your Answer”, you agree to our terms of service and acknowledge you have read our privacy policy.

Not the answer you're looking for? Browse other questions tagged or ask your own question.