4
$\begingroup$

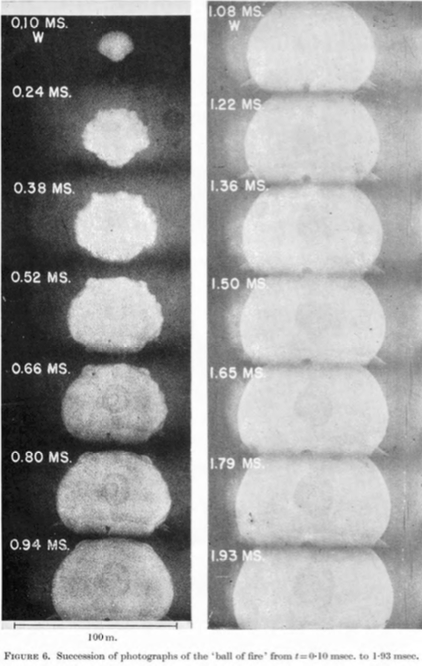
I was recently shown a very interesting sequence of images depicting the expansion of the fireball of Trinity explosion, a nuclear weapon's test conducted in New Mexico in 1945.

enter image description here

I read here that the radius as a function of time $t$ of a (nuclear) explosion depends pre-eminently on the explosion's energy $E$ and the surrounding medium's density $\rho$. Interestingly, there exists a unique way of constructing a length scale from the three quantities $E$, $\rho$, and $t$, as can be verified by dimensional analysis. It is $$ R = \left(\frac{E \, t^2}{\rho}\right)^\frac{1}{5}. $$ Consequently, by reading off the explosion's radius at $t = 0.94 \, \mathrm{ms}$ from the above image as roughly $R \approx 70 \, \mathrm{m}$ and assuming as surrounding density Earth's atmospheric density $\rho_\text{E}$ at sea level, we can get an idea of the energy of the explosion: $$ E = \frac{\rho \, R^5}{t^2} \approx 7.28 \cdot 10^{13} \, \mathrm{J} \simeq 17.4 \, \mathrm{kt} \text{ of TNT}. $$ This is basically what Geoffrey Taylor did in his 1949 paper (he guessed $16.8 \, \mathrm{kt} \text{ of TNT}$). It stirred up quite a fuss in its days by calculating and publicly announcing this and a number of other pieces of classified information about the US Trinity test which he extracted just from the above images (they had been declassified in 1947, two years after the test).

Here comes the question: Based on this information how can I estimate the temperature inside the explosion's fireball itself, i.e. after the shockwave has passed, say $t = 1 \, \mathrm{ms}$ after the explosion?

I thought about using $E = \frac{3}{2} N k_B T$. However, I don't know how to get a handle on the number of particles inside the fireball even if I know its volume. The density in there must be far lower than the surrounding Earth atmosphere.

$\endgroup$
1
  • 1
    $\begingroup$ Frank Shu has a good book on gas dynamics (well it's a two-part book and I'm referring to Volume II here). In Chapter 17 of that book, there is a detailed discussion of blast waves that you might find interesting. $\endgroup$ Commented Dec 4, 2015 at 18:57

1 Answer 1

5
$\begingroup$

You can use the ideal gas law here, $$ p=\frac{NkT}{V}=\frac{\rho kT}{\mu m_u} $$ where $\mu$ is the mean molecular weight and $m_u$ the atomic mass unit. You then have a relationship between pressure and temperature: $$ T\sim\frac{p}{\rho} $$ You then have to use an equation of state to relate the energy and pressure, e.g. $$ p=E(\gamma-1) $$ where $\gamma$ is the adiabatic index.

Note, though, that since you're given the initial energy $E$, you'd only be able to solve for the initial temperature as well. In order to get $T$ and $\rho$ as functions of space & time, you'd need to evolve the hydrodynamic equations from a point-explosion initial condition until the time you're interested in (in fact, frequently this is a test-case for hydrodynamic codes). Frank Timmes' page on the Sedov solution is probably a great starting resource for you for this.

For pressure, (radial) velocity and density, the evolution of the (normalized) blast wave problem is,
blast wave
(source)

where the subscript $s$ denotes the shocked value, as determined by the Rankine Hugoniot jump conditions.

$\endgroup$
6
  • 1
    $\begingroup$ Thanks for the answer but this doesn't address the issue of how to estimate the density within the explosion. $\endgroup$
    – Janosh
    Commented Dec 4, 2015 at 15:39
  • $\begingroup$ You have to use the mentioned hydrodynamic equations to get that. $\endgroup$
    – Kyle Kanos
    Commented Dec 4, 2015 at 15:45
  • $\begingroup$ I've updated my answer to address more about the parameters inside the blast wave. Naively taking $T=p/\rho$, you should be able to see the structure of the temperature from the plot. $\endgroup$
    – Kyle Kanos
    Commented Dec 4, 2015 at 16:18
  • 1
    $\begingroup$ @KyleKanos - You could also mention that in the strong shock limit the density compression ratio for an ideal gas goes to something like $\rho_{2}/\rho_{1} \sim \left( \gamma + 1 \right)/\left( \gamma - 1 \right)$... though it looks like that is captured in your figure. $\endgroup$ Commented Dec 4, 2015 at 18:55
  • 1
    $\begingroup$ @KyleKanos - You might also mention that the $T \propto P/\rho$ relationship is the interior temperature, which reaches its peak(minimum) value at the center(edge) of the blast wave. However, the temperature will drop off as $T \propto U_{sh}^{2} \propto t^{-6/5}$, where $t$ is time and $U_{sh}$ is the shock speed along the outward normal. $\endgroup$ Commented Dec 4, 2015 at 19:01

Your Answer

By clicking “Post Your Answer”, you agree to our terms of service and acknowledge you have read our privacy policy.

Not the answer you're looking for? Browse other questions tagged or ask your own question.