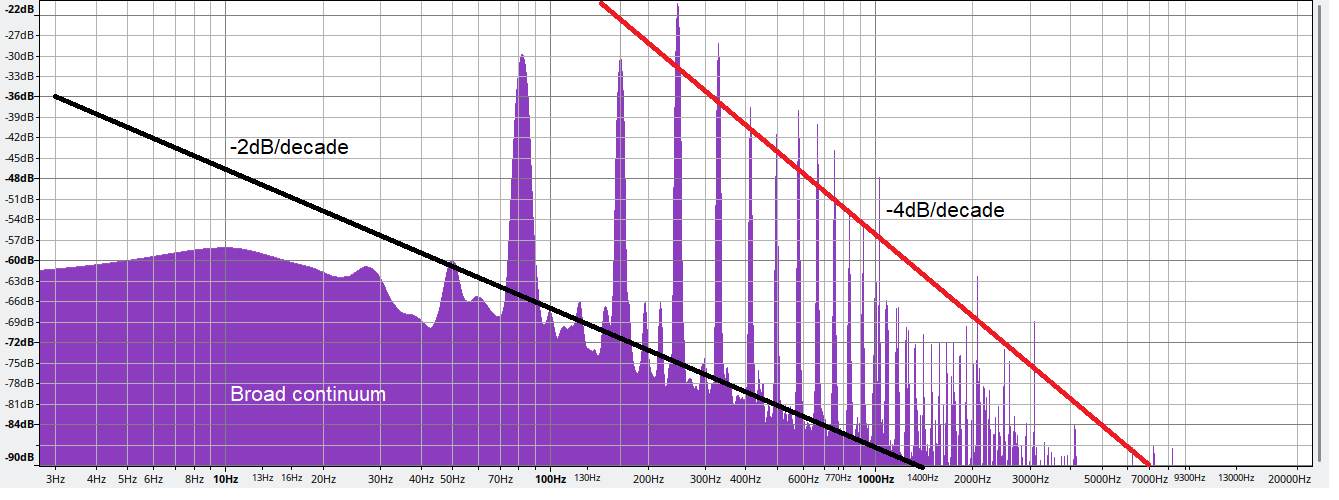
This is inspired by this music.SE question, which I attempted to offer an answer for, but the more I think about it I am still quite unsure about it.
As physicists, we often try to describe features of experimental data using minimal models to capture the essential details of the system. I'm hoping to get some insight into what minimal physical mechanisms can be used to explain the basic features in this plot. The author of that question says that they plucked the E string of the guitar (82 Hz), and in the spectrogram, we see peaks at all of the integer multiples of this frequency. Here is what I think I can explain:
The red line shows a heuristic fit for the peak amplitudes decreasing as $f^{-4}$, which makes sense: as shown in this physics.SE answer, the peak amplitudes of the Fourier components would be expected to decrease as $f^{-2}$, thus the power (amplitude squared) goes as $f^{-4}$. This is demonstrated by the red line, and gives a reasonable enough fit to the amplitudes for the third and higher harmonics.
The broadening of spectral lines is a common occurrence due to any non-linear dispersive effects such as taking into account that the string tension is a function of amplitude and frequency.
The minor peaks that appear between the larger peaks are likely resonances of the other strings of the guitar, for example just after the second harmonic the first peak appears to be the G (196 Hz) string.
Features I don't understand
Should these peaks be Lorentzian or Gaussian? In trying to produce a similar toy graph I found that I needed both a Gaussian and Lorentzian part of each peak to get a roughly similar-looking plot. What physics would contribute to these two different channels? The peaks appear to be Gaussian (the Lorentzians are too sharp whereas these are rounded near the top), while the background may be some sort of Lorentzian tail, but now I am thinking perhaps it has a different explanation.
How do we explain the "broad continuum" at low frequencies? Why does this broad continuum appear to decay as $1/f^2$ (see the black line)? My toy model with Lorentzian tails does not reproduce this behavior.
Lastly the original question from the music.SE post, why are the first and second harmonics reduced in intensity? In my answer to that question, you can find my speculations. Now after thinking for a while I feel that I am most convinced by the idea that the string was plucked off-center, along with possible resonances that might enhance some of the higher peaks, e.g. the 2nd and 3rd.
As an example of what I mean by Lorentzian and Gaussian, this is what it looks like:
on the left I show both the Guassian and Lorentzian profiles, while on the right I show their sum. It's a bit hard to see, but the Lorenzians are sharply cusped near the maximum, while the Guassians give a nice round peak the way we see in the spectrogram. Clearly the $1/f^2$ behavior of the low amplitude background is not reproduced by the sum of Lorentzian tails (black line).
Bonus points if anyone has a nice quasi-particle analogy.


