added 2220 characters in body
Source Link
Farcher
  • 99.9k
  • 5
  • 83
  • 215

Perhaps if one thinks about the intensityThe equation (energy per unit area per second)$x=A\sin\left(\dfrac{(ω_1-ω_2)t}{2}\right)\times \cos\left(\dfrac{(ω_1+ω_2)t}{2}\right)$ can be thought of as consisting of two parts which are multiplied together.

The $\cos\left(\dfrac{(ω_1+ω_2)t}{2}\right)$ term which is an oscillation at a wave rather thanfrequency which is the amplitudeaverage of the wave$\omega_1$ and $\omega_2$.

The $A\sin\left(\dfrac{(ω_1-ω_2)t}{2}\right)$ term which oscillates at a lower frequency, $\dfrac{(ω_1-ω_2)}{2}$, than the doublingother term and has an amplitude $A$.

Adding some numbers, let $A=1,\,\omega_1 = 2\,\pi\,100.5$ and $\omega_2 = 2\,\pi\,99.5$, which is a difference of $1\,\rm Hz$.

Thus $\dfrac{(ω_1+ω_2)}{2} = 2\,\pi\, 100$ and $\dfrac{(ω_1-ω_2)}{2} = 2\,\pi\, \frac 12$ ie oscillations at $100\,\rm Hz$ are changing in amplitude at a frequency becomes clearer?of $\frac 12\,\rm Hz$ as shown in the graph below.

enter image description hereenter image description here

YouThe variation in amplitude of the wave of frequency $100\,\rm Hz$ is shown in the right hand diagram.
The $100\,\rm Hz$ wave cannot be properly drawn because between $t=0\,\rm s$ and $t=1\,\rm s$ one hundred oscillations would have to be displayed.

What you will note is that there is zero amplitude of the $\sin^2(t)$ envelope modulates$100\,\rm Hz$ wave at $t=0\,\rm s$, maximum amplitude at $t=\frac 12\,\rm s$, zero amplitude at at $t=1\,\rm s$, maximum amplitude at $t=\frac 32\,\rm s$, zero amplitude at at $t=2\,\rm s$.
Thus in $2$ seconds (the period of the $\sin^2(20t)$ graph and that modulation envelope has twice$\sin \left(2\,\pi\,\frac12\right)$ term, the frequencyamplitude of the $\sin(t)$ graph$100\rm \, Hz$ goes through two oscillations ie the beat frequency is $\dfrac{(ω_1-ω_2)}{2} \times 2 = ω_1-ω_2$ which in the case is $100.5-99.5=1\,\rm Hz$.


Or put another wayPerhaps what you actually hear will become clearer after you use this rather nice simulation, Interference in Time and Beats Simulation?

When first started the intensity modulating envelopesimulation sets $\sin^2(t) = \frac12(1-\cos(2t)$, which is made up of$f_{\rm A}=300\,\rm Hz$ and $f_{\rm B}=305\,\rm Hz$.

On running the simulation you will hear a sound wave of frequency $\cos(2t)$ function displaced by$302.5\rm\,Hz$ $+1$$pulsating$ at a frequency of $5\rm\,Hz$ which has twiceis the beat frequency.

Keeping frequency $f_{\rm A}$ the same change $f_{\rm B}$ to:

$\bf 1$ $301\,\rm Hz$ to hear a $1\rm\,Hz$ beat,

$\bf 2$ $300.1\,\rm Hz$ to hear a $0.1\rm\,Hz$, period $10\,\rm s$, beat,

$\bf 3$ $300.05\,\rm Hz$ to hear a $0.05\rm\,Hz$, period $20\,\rm s$, beat. [Do not worry that the hundredth of a hertz are not displayed as the simulation will still work.]

$\bf 4$ Have fun noting that the lowest available frequency is $\sin(t)$ function$40\,\rm Hz$ and the highest $1000\,\rm Hz$ so it is not possible with this simulation to show two ultrasonic frequencies producing an audible beat frequency eg $40,000\,\rm Hz$ and $40,100\,\rm Hz$ producing an audible $100\,\rm Hz$ tone

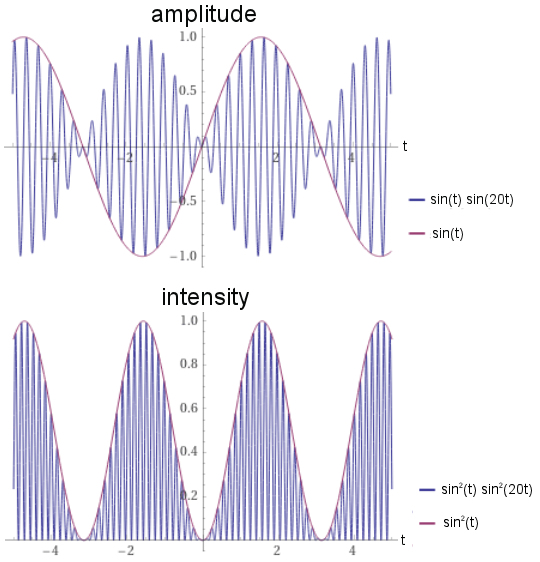
Perhaps if one thinks about the intensity (energy per unit area per second) of a wave rather than the amplitude of the wave the doubling of frequency becomes clearer?

enter image description here

You will note that the $\sin^2(t)$ envelope modulates the $\sin^2(20t)$ graph and that modulation envelope has twice the frequency of the $\sin(t)$ graph.

Or put another way, the intensity modulating envelope $\sin^2(t) = \frac12(1-\cos(2t)$, which is made up of a $\cos(2t)$ function displaced by $+1$ which has twice the frequency of a $\sin(t)$ function

The equation $x=A\sin\left(\dfrac{(ω_1-ω_2)t}{2}\right)\times \cos\left(\dfrac{(ω_1+ω_2)t}{2}\right)$ can be thought of as consisting of two parts which are multiplied together.

The $\cos\left(\dfrac{(ω_1+ω_2)t}{2}\right)$ term which is an oscillation at a frequency which is the average of $\omega_1$ and $\omega_2$.

The $A\sin\left(\dfrac{(ω_1-ω_2)t}{2}\right)$ term which oscillates at a lower frequency, $\dfrac{(ω_1-ω_2)}{2}$, than the other term and has an amplitude $A$.

Adding some numbers, let $A=1,\,\omega_1 = 2\,\pi\,100.5$ and $\omega_2 = 2\,\pi\,99.5$, which is a difference of $1\,\rm Hz$.

Thus $\dfrac{(ω_1+ω_2)}{2} = 2\,\pi\, 100$ and $\dfrac{(ω_1-ω_2)}{2} = 2\,\pi\, \frac 12$ ie oscillations at $100\,\rm Hz$ are changing in amplitude at a frequency of $\frac 12\,\rm Hz$ as shown in the graph below.

enter image description here

The variation in amplitude of the wave of frequency $100\,\rm Hz$ is shown in the right hand diagram.
The $100\,\rm Hz$ wave cannot be properly drawn because between $t=0\,\rm s$ and $t=1\,\rm s$ one hundred oscillations would have to be displayed.

What you will note is that there is zero amplitude of the $100\,\rm Hz$ wave at $t=0\,\rm s$, maximum amplitude at $t=\frac 12\,\rm s$, zero amplitude at at $t=1\,\rm s$, maximum amplitude at $t=\frac 32\,\rm s$, zero amplitude at at $t=2\,\rm s$.
Thus in $2$ seconds (the period of the $\sin \left(2\,\pi\,\frac12\right)$ term, the amplitude of the $100\rm \, Hz$ goes through two oscillations ie the beat frequency is $\dfrac{(ω_1-ω_2)}{2} \times 2 = ω_1-ω_2$ which in the case is $100.5-99.5=1\,\rm Hz$.


Perhaps what you actually hear will become clearer after you use this rather nice simulation, Interference in Time and Beats Simulation?

When first started the simulation sets $f_{\rm A}=300\,\rm Hz$ and $f_{\rm B}=305\,\rm Hz$.

On running the simulation you will hear a sound wave of frequency $302.5\rm\,Hz$ $pulsating$ at a frequency of $5\rm\,Hz$ which is the beat frequency.

Keeping frequency $f_{\rm A}$ the same change $f_{\rm B}$ to:

$\bf 1$ $301\,\rm Hz$ to hear a $1\rm\,Hz$ beat,

$\bf 2$ $300.1\,\rm Hz$ to hear a $0.1\rm\,Hz$, period $10\,\rm s$, beat,

$\bf 3$ $300.05\,\rm Hz$ to hear a $0.05\rm\,Hz$, period $20\,\rm s$, beat. [Do not worry that the hundredth of a hertz are not displayed as the simulation will still work.]

$\bf 4$ Have fun noting that the lowest available frequency is $40\,\rm Hz$ and the highest $1000\,\rm Hz$ so it is not possible with this simulation to show two ultrasonic frequencies producing an audible beat frequency eg $40,000\,\rm Hz$ and $40,100\,\rm Hz$ producing an audible $100\,\rm Hz$ tone

Source Link
Farcher
  • 99.9k
  • 5
  • 83
  • 215

Perhaps if one thinks about the intensity (energy per unit area per second) of a wave rather than the amplitude of the wave the doubling of frequency becomes clearer?

enter image description here

You will note that the $\sin^2(t)$ envelope modulates the $\sin^2(20t)$ graph and that modulation envelope has twice the frequency of the $\sin(t)$ graph.

Or put another way, the intensity modulating envelope $\sin^2(t) = \frac12(1-\cos(2t)$, which is made up of a $\cos(2t)$ function displaced by $+1$ which has twice the frequency of a $\sin(t)$ function