With one change this should work.
For a transmission experiment you'd probably be better printing on a transparency. I haven't tried this, mind you, but laser printers can achieve the necessary scale quite easily.
You might be able to get it to work in reflection mode printed to paper, but you are going to lose a lot of intensity. Didn't work with the tools I have on hand (albeit I'm on vacation). That said I you can print fine enough lines with a fairly inexpensive printer.
I made it work!
(Well, at least the simple linear grating; more complex patterns will have to wait for more time to devote to the project.)
Once I got back to school and then found some time one day when my freshman lab wrapped up early, I was finally able to devote a little more time to this. I reworked the latex file (below) to give me several different line thickness and pitches.
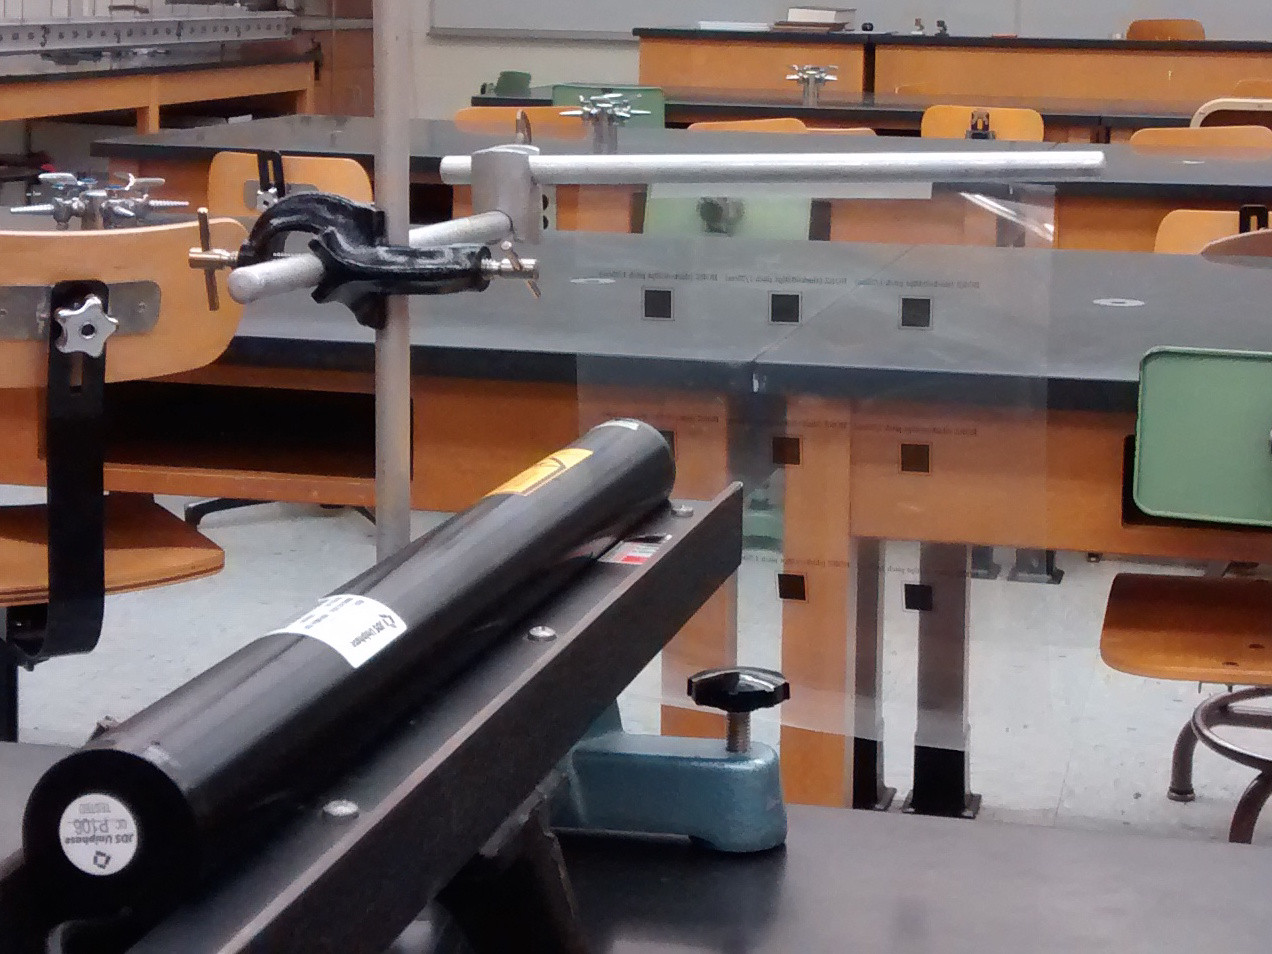
My experimental setup used approximately 8 meters from grating to projection surface:

You can see our higher harmonic green He-Ne laser (543 nm wavelength) in the foreground and the transparency hanging loosely just beyond. In the background the pattern appears dimly on the front face of the instructors lab-bench.
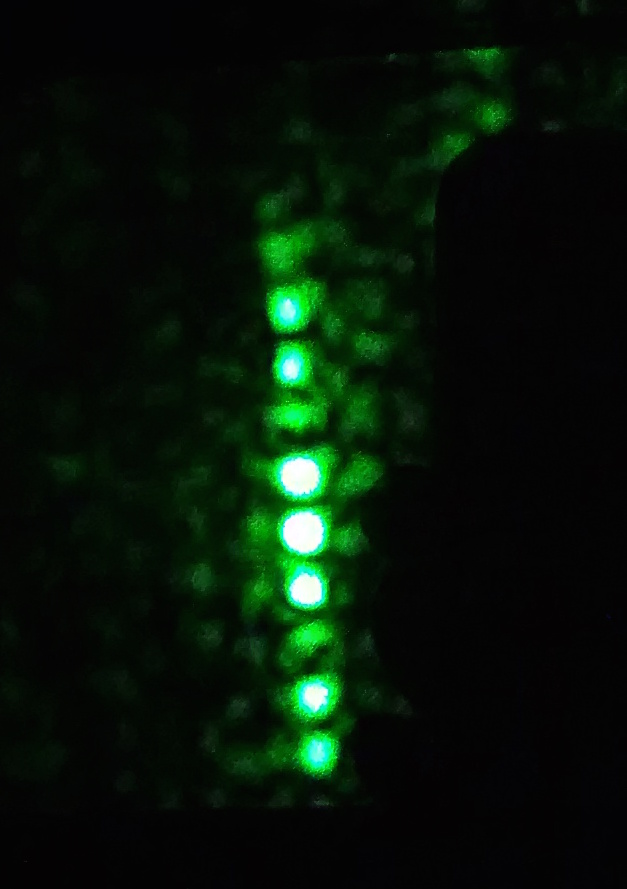
Closeup of the diffraction pattern with the lights off

the sharp cutoffs at the top and bottom of the image result from features of the ad hoc setup I'm using here.
So What spacing do you want?
At my school we have a demonstration grating consisting of crossed planes of fine copper wire at about 40 wires per cm (actually 100 wires per inch) that can be used in transmission or reflection to form planar diffraction patterns.
For basic testing purposes it may be easier to start with a simple linear grating, or a crossed-lines one.
The results of my trial runs seem to be pretty sensitive to line pitch and spacing (and I assume to aliasing effects), so some trial and error is probably in order.
The LaTeX code I used to prepare my text sample
\documentclass[letterpaper,10pt]{article}

\usepackage{pgfplots}
\pgfplotsset{compat=1.11,ticks=none}

\usepackage{ifpdf}
\ifpdf
\setlength{\pdfpagewidth}{8.5in}
\setlength{\pdfpageheight}{11in}
\else
\fi

%
% Recall that the zero point in 1in down, and 1in in from the
% left.
% \setlength{\topmargin}{0.625in}
% \setlength{\textheight}{8.0in}
% \setlength{\oddsidemargin}{0.25in}
% \setlength{\textwidth}{6.0in}
\addtolength{\oddsidemargin}{-0.75in}
\addtolength{\textwidth}{0.5in}


\begin{document}
\vfill

\hbox{
  \begin{tikzpicture}
    \begin{axis}[
      title={HORZ (thick=0.03pt pitch 1/25cm)},
      xtick=,
      xticklabels={,,}
      ytick=,
      yticklabels={,,},
      x=0.25cm,
      y=0.25cm,
      ]
      \foreach \yval in {1,...,124}
      \addplot[black,domain=0:5.0,line width=0.03pt] {\yval/25};

    \end{axis}
  \end{tikzpicture}
  \hfill

  \begin{tikzpicture}
    \begin{axis}[
      title={HORZ (thick=0.06pt pitch 1/25cm)},
      xtick=,
      xticklabels={,,}
      ytick=,
      yticklabels={,,},
      x=0.25cm,
      y=0.25cm,
      ]
      \foreach \yval in {1,...,124}
      \addplot[black,domain=0:5.0,line width=0.06pt] {\yval/25};

    \end{axis}
  \end{tikzpicture}
  \hfill

  \begin{tikzpicture}
    \begin{axis}[
      title={HORZ (thick=0.09pt pitch 1/25cm)},
      xtick=,
      xticklabels={,,}
      ytick=,
      yticklabels={,,},
      x=0.25cm,
      y=0.25cm,
      ]
      \foreach \yval in {1,...,124}
      \addplot[black,domain=0:5.0,line width=0.06pt] {\yval/25};

    \end{axis}
  \end{tikzpicture}
}
\vfill

\hbox{
  \begin{tikzpicture}
    \begin{axis}[
      title={HORZ (thick=0.03pt pitch 1/33cm)},
      xtick=,
      xticklabels={,,}
      ytick=,
      yticklabels={,,},
      x=0.25cm,
      y=0.25cm,
      ]
      \foreach \yval in {1,...,165}
      \addplot[black,domain=0:5.0,line width=0.03pt] {\yval/33};

    \end{axis}
  \end{tikzpicture}
  \hfill

  \begin{tikzpicture}
    \begin{axis}[
      title={HORZ (thick=0.06pt pitch 1/33cm)},
      xtick=,
      xticklabels={,,}
      ytick=,
      yticklabels={,,},
      x=0.25cm,
      y=0.25cm,
      ]
      \foreach \yval in {1,...,165}
      \addplot[black,domain=0:5.0,line width=0.06pt] {\yval/33};

    \end{axis}
  \end{tikzpicture}
  \hfill

  \begin{tikzpicture}
    \begin{axis}[
      title={HORZ (thick=0.09pt pitch 1/33cm)},
      xtick=,
      xticklabels={,,}
      ytick=,
      yticklabels={,,},
      x=0.25cm,
      y=0.25cm,
      ]
      \foreach \yval in {1,...,165}
      \addplot[black,domain=0:5.0,line width=0.06pt] {\yval/33};

    \end{axis}
  \end{tikzpicture}
}
\vfill

\hbox{
  \begin{tikzpicture}
    \begin{axis}[
      title={HORZ (thick=0.03pt pitch 1/50cm)},
      xtick=,
      xticklabels={,,}
      ytick=,
      yticklabels={,,},
      x=0.25cm,
      y=0.25cm,
      ]
      \foreach \yval in {1,...,249}
      \addplot[black,domain=0:5.0,line width=0.03pt] {\yval/50};

    \end{axis}
  \end{tikzpicture}
  \hfill

  \begin{tikzpicture}
    \begin{axis}[
      title={HORZ (thick=0.06pt pitch 1/50cm)},
      xtick=,
      xticklabels={,,}
      ytick=,
      yticklabels={,,},
      x=0.25cm,
      y=0.25cm,
      ]
      \foreach \yval in {1,...,249}
      \addplot[black,domain=0:5.0,line width=0.06pt] {\yval/50};

    \end{axis}
  \end{tikzpicture}
  \hfill

  \begin{tikzpicture}
    \begin{axis}[
      title={HORZ (thick=0.09pt pitch 1/50cm)},
      xtick=,
      xticklabels={,,}
      ytick=,
      yticklabels={,,},
      x=0.25cm,
      y=0.25cm,
      ]
      \foreach \yval in {1,...,249}
      \addplot[black,domain=0:5.0,line width=0.06pt] {\yval/50};

    \end{axis}
  \end{tikzpicture}
}
\vfill

\end{document}


