92
votes
$\begingroup$

Undoubtedly, people use a variety of programs to draw diagrams for physics, but I am not familiar with many of them. I usually hand-draw things in GIMP which is powerful in some regards, but it is time consuming to do things like draw circles or arrows because I make them from more primitive tools. It is also difficult to be precise.

I know some people use LaTeX, but I am not quite sure how versatile or easy it is. The only other tools I know are Microsoft Paint and the tools built into Microsoft Office.

So, which tools are commonly used by physicists? What are their good and bad points (features, ease of use, portability, etc.)?

I am looking for a tool with high flexibility and minimal learning curve/development time. While I would like to hand-draw and drag-and-drop pre-made shapes, I also want to specify the exact locations of curves and shapes with equations when I need better precision. Moreover, minimal programming functionality would be nice additional feature (i.e. the ability to run through a loop that draws a series of lines with a varying parameter).

Please recommend few pieces of softwares if they are good for different situations.

$\endgroup$
2

20 Answers 20

45
votes
$\begingroup$

I've had good experiences with Inkscape. It has a GUI interface, but allows you to enter coordinates directly if you want, and it's scriptable. There is a plug-in that allows you to enter LaTeX directly (for labels and such). The downside is that it is very much still in development, so sometimes you find that a feature you want is not completely implemented yet.

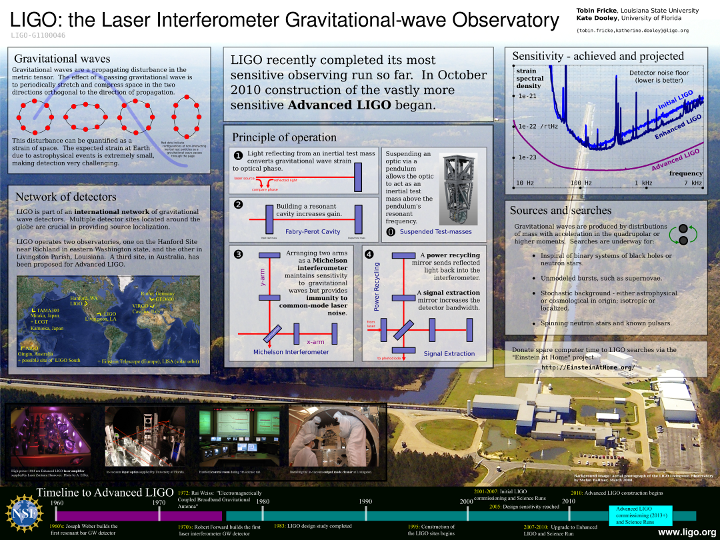
As an example, here is a poster I made last week, entirely within Inkscape: Poster made with Inkscape

Inkscape now also has the "JessyInk" plug-in which allows you to use it to make presentations (à la Powerpoint). The presentation can be viewed in a web browser as SVG, or exported to PDF.

If you have a Mac and don't mind spending some money ($100), I've heard good things about OmniGraffle.

$\endgroup$
6
  • 6
    $\begingroup$ I've used Inkscape a lot (though I prefer LaTeX/TikZ) and it's been very rare that I need a feature which isn't implemented. $\endgroup$
    – David Z
    Nov 9, 2010 at 6:59
  • $\begingroup$ Thanks for the tip. I have just started going through the tutorial for Geogebra (geogebra.org/cms), and will give Inkscape a look next. $\endgroup$ Nov 9, 2010 at 7:13
  • $\begingroup$ In general something for vector drawing; I'm using CorelDraw for such things, yet it is not free and Windows only (indeed it is the only reason why I have Windows installed). $\endgroup$
    – user68
    Nov 9, 2010 at 10:25
  • 1
    $\begingroup$ +1 for Inkscape, especially when used with the LaTeX render function. It's nice having diagrams in vector (SVG) form, so that they can be easily rescaled, layers changed and so on, as needed. $\endgroup$
    – ihuston
    Nov 9, 2010 at 13:52
  • $\begingroup$ Also, you can export graphs from gnumeric in svg format and import them in inkscape: screencasters.heathenx.org/episode-078 $\endgroup$ Jan 13, 2011 at 9:36
41
votes
$\begingroup$

I'm learning TikZ (a drawing package for LaTeX) as we speak. It's good for two-dimensional line drawings, the syntax for specifying shapes and curves is extremely versatile, but the learning curve is steeper than LaTeX even.

There is a superb gallery of TikZ examples.

Here is another collection of neat TikZ examples on SE.tex.

$\endgroup$
10
  • 10
    $\begingroup$ It's worth noting that TikZ is far better documented than LaTeX as a whole, which IMO more than makes up for the learning curve. $\endgroup$
    – David Z
    Feb 13, 2011 at 2:44
  • 4
    $\begingroup$ Actually, LaTeX is better documented: it's just that you have to buy the documentation. I disagree that TikZ' documentation makes up for the learning curve. It's extremely wordy, and the tutorial part doesn't structure the information so that you learn a basic framework first - you can't start making your own diagrams until you've been through a large portion of it. $\endgroup$
    – ptomato
    Feb 13, 2011 at 9:00
  • 4
    $\begingroup$ Is it permitted for use in journal publications? $\endgroup$ Jul 20, 2011 at 9:38
  • 3
    $\begingroup$ By the way, AIP has this to say about LaTeX: "While we appreciate the benefits to authors of preparing manuscripts in TeX, especially for math-intensive manuscripts, it is neither a cost-effective composition tool (for the volume of pages AIP currently produces) nor is it a format that can be used effectively for online publishing." (aip.org/pubservs/compuscript.html#prepare) $\endgroup$
    – ptomato
    Jul 20, 2011 at 11:35
  • 4
    $\begingroup$ @ptomato: On the other hand, Physical Review and related journals prefer submissions in LaTeX (using revtex, of course). The part about using revtex is important, because it allows them to confidently processes manuscripts for web and print automatically. Accepting arbitrary LaTeX is hard, but accepting a large-but-well-defined subset is manageable. $\endgroup$ Nov 26, 2011 at 22:25
33
votes
$\begingroup$

I'll interpret your term diagram as "any fancy image that captures some physics".

For this I can hardly recommend anything else then MetaPost. It's on par with TeX in being a little hard to learn but once you do master the basics you won't believe you could have ever used anything else (in particular, GIMP and Inkscape; good analogy here would be to TeX vs. MS Word).

Basic properties

  1. it's a (simple) programming language
  2. it's vectorial (this should probably go without saying but still)
  3. it's primitives are things like points, lines, paths, splines
  4. it contains excellent image manipulation facilities; you can say things like "take this image, scale it up by two and rotate it by 60 degrees"
  5. you can insert TeX labels
  6. it can solve equations; This is a real killer that no one else offers. You can draw two curves $X(t)$ and $Y(t)$ (defined most comfortably as splines) and tell MP to compute their intersection, draw a point there and label it with some text

Success story

I used MP to create some polygons on a hexagonal lattice in the context of cluster expansions. There was a huge number of those polygons to draw, so I quickly abandoned all hope of trying to draw them by hand in Inkscape or something similar. True, it would probably be quicker in the end, but I hate manual work; I rather spend much longer learning some programming language and then just code all the work in few minutes. So I put together simple MP program that has converted my input data (vertices and edges of the polygons as just numbers) into beautiful images. For a one night's work and my first time with MP I was more than satisfied.

Goodies

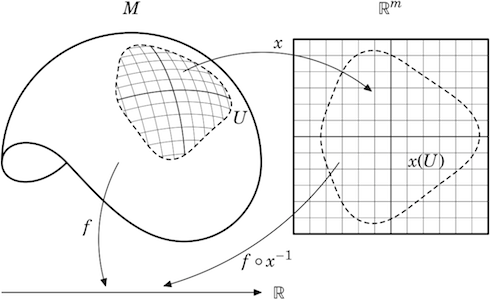
alt text

Credit for this amazing picture goes to Johan Kåhrström (go also see more stuff under illustrations there).

$\endgroup$
6
  • 1
    $\begingroup$ Excellent summary and example image! Thanks, Marek. $\endgroup$ Dec 23, 2010 at 23:23
  • $\begingroup$ @Mark: I only now noticed that this was a community wiki and other answers are just few lines long. So I wonder whether this long answer is suitable here (I don't want to steal too much space just for myself). Still, seeing that you like it, it can probably stay :-) $\endgroup$
    – Marek
    Dec 23, 2010 at 23:32
  • $\begingroup$ Beautiful example! $\endgroup$
    – nibot
    Jan 17, 2011 at 16:29
  • $\begingroup$ I think TikZ can actually do all the things you mentioned in your list. $\endgroup$
    – David Z
    Jan 17, 2011 at 19:42
  • 1
    $\begingroup$ Wow, the image is awesome. $\endgroup$ Sep 12, 2012 at 9:50
26
votes
$\begingroup$

First of all do not use a raster graphics software like Gimp to draw pictures. This has serious disadvantages when you want to make screen readable documents (the picture pixelizes). For this purpose always use vector graphics. Wikipedia has a nice list of vector graphics software. Among them, I'd recommend the following:

  • Inkscape (Cross-platform): Although the learning curve is a bit steep, its worth it. Note that Inkscape was not meant for making scientific diagram. Still you'll find a LaTeX plugin, export to LaTeX/PSTricks etc.

  • Dia (Cross-platform): Very simple and easy, but not very powerful. Can't process LaTeX.

  • Ipe (Cross-platform): Ipe is something in between Inkscape and Dia. Also Ipe was designed for scientific drawing. Can process LaTeX source code and import PDF figures.

  • WinFIG (Cross-platform): Although commercial, its quite popular in the scientific community.

EDIT: Wikipedia has a nice page which discusses various software that can be used to create figures. See Wikipedia:How to create graphs for Wikipedia articles

$\endgroup$
0
12
votes
$\begingroup$

I would try matplotlib, but first check here and decide if these pictures satisfies your needs. Also click some picture and inspect source code.

$\endgroup$
4
  • $\begingroup$ Those are some nice-looking pictures! I suppose I would have to learn Python, though. $\endgroup$ Nov 9, 2010 at 8:09
  • 3
    $\begingroup$ @Mark : It's never to early to lear python ;) $\endgroup$ Dec 3, 2010 at 16:57
  • $\begingroup$ It is only fair to mention that matplotlib is extremely similar to MATLAB: Similar user interface, similar capabilities, similar default styles, etc. One advantage of Matplotlib over matlab is that you get to use python, which is a better programming language than matlab. Another is that matplotlib is free, while matlab is prohibitively expensive unless you get it through work or school or pirated. On the other hand, MATLAB has better help files, easier installation, and a bigger scientific user base [but I hope those things will eventually change.] $\endgroup$ Nov 5, 2012 at 20:49
  • $\begingroup$ I used matplotlib for many graphics in my thesis. The only downside is the lack of tex output. This meant I had to import my .svg files in Inkscape to add text an then export is as tex. $\endgroup$
    – BandGap
    Apr 26, 2013 at 14:19
9
votes
$\begingroup$

Related post in SO.

My personal favorite is Asymtpote which is like MetaPost on steroids. A gallery is here.

$\endgroup$
2
  • $\begingroup$ I read about Asymptote when I was deciding whether to learn MP or something else. Something put me off; whether it was C++-like syntax, only LaTeX support, or perhaps something else (I don't remember whether anything of this has to do with Asymptote or some other program anymore). Could you describe the differences with MP a little? I'd be all for learning Asymptote if it proves to be a better alternative. $\endgroup$
    – Marek
    Dec 23, 2010 at 23:49
  • 4
    $\begingroup$ @Marek Wow this is an old thread, but it seems your question was never answered. I personally favor Asymptote, since it gives pretty much all the power of MP but with a much more streamlined syntax. I like it and I don't even like OO programming. Whatever geometric things you commonly draw probably already exist as very natural functions. Plus, it draws on LaTeX to make the labels typeset well. And if you so desire you can integrate Asy commands seamlessly into a Tex document by using the right package, though I prefer to keep them separate. Asy is definitely underappreciated. $\endgroup$
    – user10851
    Nov 28, 2012 at 2:02
9
votes
$\begingroup$

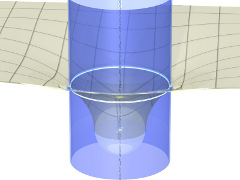
Sometimes raster graphics is also necessary. I often used POV-Ray to make some illustrations. black hole

It may be prepared with any size using the same script with description of the picture, that avoid scaling problem. But it is not a graphical editor and fast only for preparation of simple pictures.

$\endgroup$
8
votes
$\begingroup$

Just for completeness, I'll leave this here:

It's always possible to compose your illustrations in raw postscript! Postscript is itself a Forth-like programming language. It's particularly useful for illustrations that lend themselves to being generated procedurally. If postscript itself is too low-level, one can often write a script in some other language that outputs a postscript program.

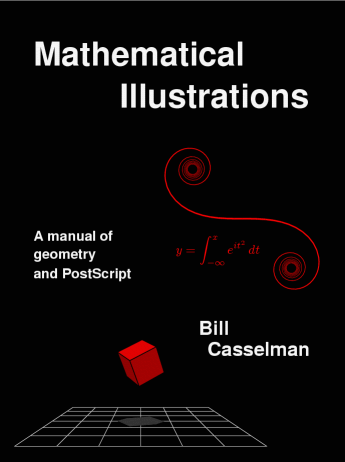
One superb introduction to producing drawings in raw postscript is this free book:

Cover illustration: Mathematical Illustrations by Bill Casselman

$\endgroup$
1
  • $\begingroup$ Nice book it seems. I have to check it out! $\endgroup$
    – 71GA
    Jul 7, 2013 at 9:53
7
votes
$\begingroup$

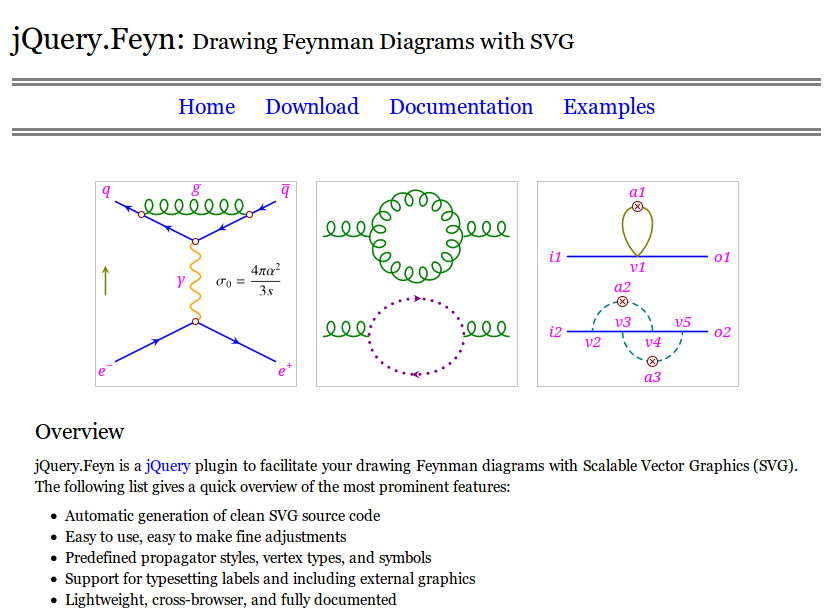
For drawing Feynman diagrams with SVG, I have developed jQuery.Feyn to make it easier (see the screenshot below). enter image description here

$\endgroup$
5
votes
$\begingroup$

I've recently been introduced to GeoGebra, and while I haven't yet had the opportunity to use for any work, I love the interface. For geometrical diagrams it looks spectacular.

I've also used XFig and gnuplot extensively. Particularly if you use $\LaTeX$, these tools serve their purpose very very well.

$\endgroup$
2
  • $\begingroup$ I've been using Geogebra since you pointed this out. It's great! $\endgroup$ Jun 17, 2013 at 10:12
  • $\begingroup$ Moreover, GG can also generate Tikz/asymptote codes, which is awesome :) $\endgroup$ Dec 24, 2013 at 10:08
4
votes
$\begingroup$

For primitive drawings, I am a big fan of XFig. The UI is a little clunky, but it can save to dozens of graphics formats and creates figures that are downright trivial to include in a LaTeX document. The biggest thing for me is that the file format is text-based, so it is completely possible to script more complicated drawings.

$\endgroup$
4
votes
$\begingroup$

I too use Mathematica for figures and found it wasn't a great leap from there to using it for drawings. You can draw 2D or 3D primitives pretty easily:

Rectangle[{xmin, ymin}, {xmax, ymax}]

and, like python/matplotlib, being able to parameterise everything allows you to redraw an image for multiple scenarios (or Animate or Manipulate it).

For me the most useful feature is that you can define things in terms of the maths. The MetaPost example mentioned by Marek, in which two curves can be defined and the intersection computed by the drawing package, is handled inherently by Mathematica.

$\endgroup$
4
votes
$\begingroup$

I thought a lot about this question since I graduated and began teaching. I think Adobe Illustrator is the best vector image software. It doesn't require any code to draw images; you only have to learn to use some "important" tools. I'm in no way a graphic designer or a professional in Illustrator and I drew this:


Moreover,

  1. you can always find tutorials about drawing anything with Illustrator
  2. You can export images from Matlab or Autocad to Illustrator (.ai or .eps)

$\endgroup$
1
  • 4
    $\begingroup$ Perhaps you should also say a word about the principal drawback of adobe illustrator : it's price ! It's for professionals, not to make simple schemes. $\endgroup$
    – FraSchelle
    Jan 22, 2014 at 10:52
3
votes
$\begingroup$
  1. Software for drawing geometry diagrams
  2. Sometimes I use SAGE.
$\endgroup$
2
  • $\begingroup$ Thanks. Do you have any opinions beyond what's said in that thread? $\endgroup$ Nov 9, 2010 at 6:44
  • 2
    $\begingroup$ No. Nothing beyond whats said! I use mspaint :) $\endgroup$ Nov 9, 2010 at 7:38
3
votes
$\begingroup$

To start with, for scientific drawing usually vector graphics is more suitable - scalable, convenient to modify and produce less bulky files.

For simple general-purpose graphics I use OpenOffice.org Draw (I prefer it to Incscape).

For abstract diagrams there is yEd - Graph Editor.

Both are free, for Win/Linux/MacOSX, easy to learn and can export to vector graphics and pdf.

$\endgroup$
3
votes
$\begingroup$

I use TKPAINT which still works very well.

http://www.netanya.ac.il/~samy/tkpaint.html

First, one has to download ActiveTcl for Windows or its Tcl counterparts for Linux or whatever you use. It can draw filled or empty disks, ellipses, squares, rectangles, splines, rotate them, quickly copy them, move them, texts with many fonts, colors, grid, and it may be exported as EPS - encapsulated postscript as well - which is a standard way to embed similar diagrams in TeX papers on the arXiv and beyond.

I've used it in many papers when I was writing them.

Cheers LM

$\endgroup$
3
votes
$\begingroup$

For electric circuits, CircuitLab is a nice online editor and simulator. There are some restrictions to what you can do without an account or with a free account - I can't remember the details - but you can use print-screen to get nice pictures out of it. I like it because it is really at the level of simplicity I need: if I'm explaining a basic electric-circuits question, I do not want to spend more than two minutes drawing, say, five resistors in some parallel/series configuration. CircuitLab gets the job done.

For a tour, see their YouTube video Getting Started with CircuitLab.


Edit: If you want a png output to include in a post on this site, you can go over to Electrical Engineering, which has a built-in implementation in the post editor and simply bring back the image link. Thanks to Chris White for the tip!

$\endgroup$
0
2
votes
$\begingroup$

There is an add-in for Microsoft Word called Science Teacher's Helper. http://www.helpscience.com

SmartDraw is also an excellent program for creating diagrams. http://www.smartdraw.com

$\endgroup$
2
votes
$\begingroup$

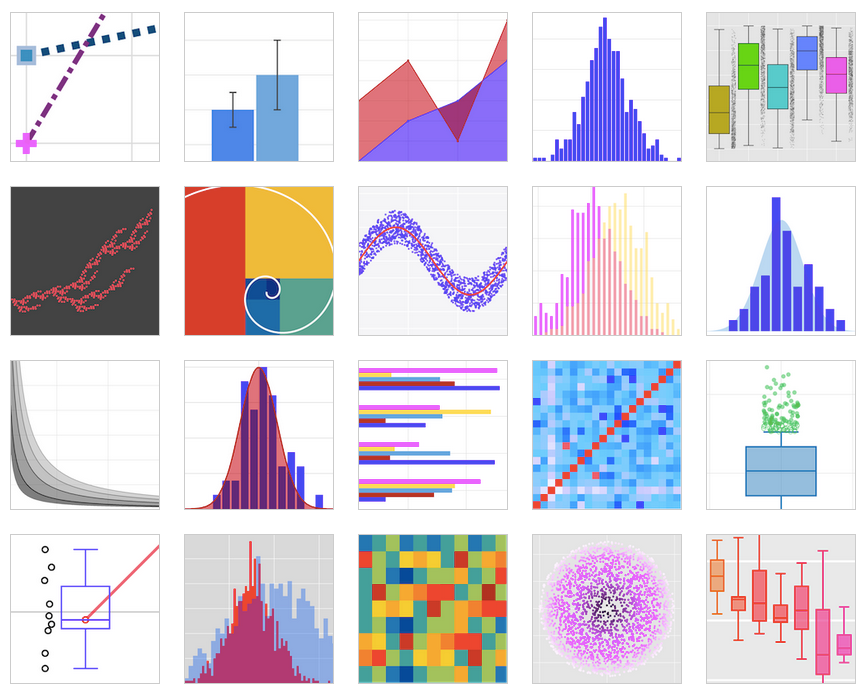
You can also use PLotly, a collaborative, web-based graphing platform with APIs in Python, R, MATLAB, Julia, and Perl. You you can find the code to make these examples in their documentation.

here.

$\endgroup$
1
0
votes
$\begingroup$

Look at SCaVis software. It has many examples illustrating how to draw various graphs. Here is the link to the examples

$\endgroup$

Not the answer you're looking for? Browse other questions tagged or ask your own question.