How can we draw Poincaré plane and phase portrait for the Logistic Map for different parameter values?
1 Answer
For dynamical systems in general, you typically simulate the dynamics in a computer - for instance, numerically integrating differential equations, or iterating a map - and then you can analyze your data. The tools mentioned in the question are primarily used for visualizing the solutions:
- a phase portrait is usually the plot of one or more trajectories in the system's phase space (which is its state space, i.e., a space where each point denotes a different system state);
- a Poincaré plot is (for 1-D systems) a plot of, e.g., $x_{n+1}$ against $x_n$, i.e., for a trajectory $x_0, x_1, x_2, x_3, ...$ the Poincaré plot will be 2-D with points $(x_0,x_1), (x_1,x_2), (x_2,x_3), ...$;
- don't mix up the Poincaré plot with the similarly named Poincaré map, which displays trajectories at a lower dimensionality than that of the system, by means of a section of its phase space (for details see answers 1 and 2, Wikipedia, ...). As for logistic map, it's 1-D, so it has a 0-D Poincaré section/map - not that useful for visualization purposes.
How can we draw Poincare plane and phase portrait to Logistic Map for different parameter values?
- choose the value of the parameter $r$;
- choose an initial condition for the state variable $x$: that's $x_{n=0}$;
- obtain $x_0$'s trajectory by iterating $x_{n+1}=rx_n(1-x_n)$.
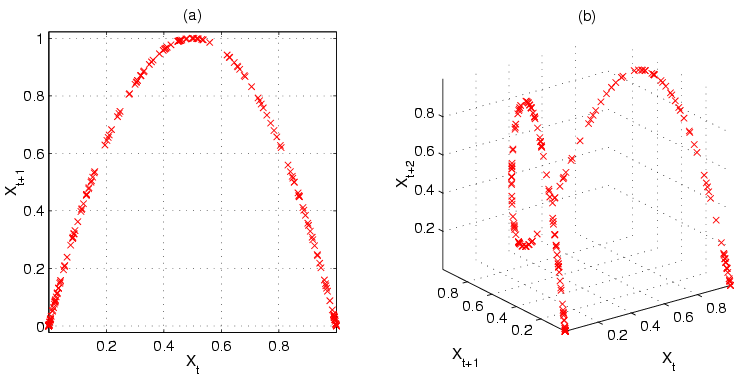
Now, with this trajectory in hands, you can obtain plots (by hand or software) such as the Poincaré plot for $r=4$ displayed in the Logistic Map's Wikipedia entry:
For a different parameter value, you'd obtain a different plot. A 3-D plot with axes $r$, $x_{n+1}$, and $x_n$ would also be a possibility.
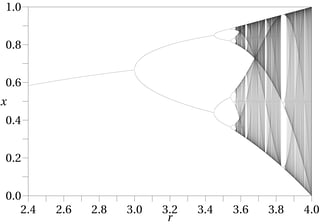
The logistical phase portrait is simply a segment of line, $x_n \in [0,1]$. It can show which parts of it are more densely populated by trajectories, and a 2-D plot of $\{x_n\}$ as a function of the parameter $r$ is known as a bifurcation diagram. Again from Wikipedia:
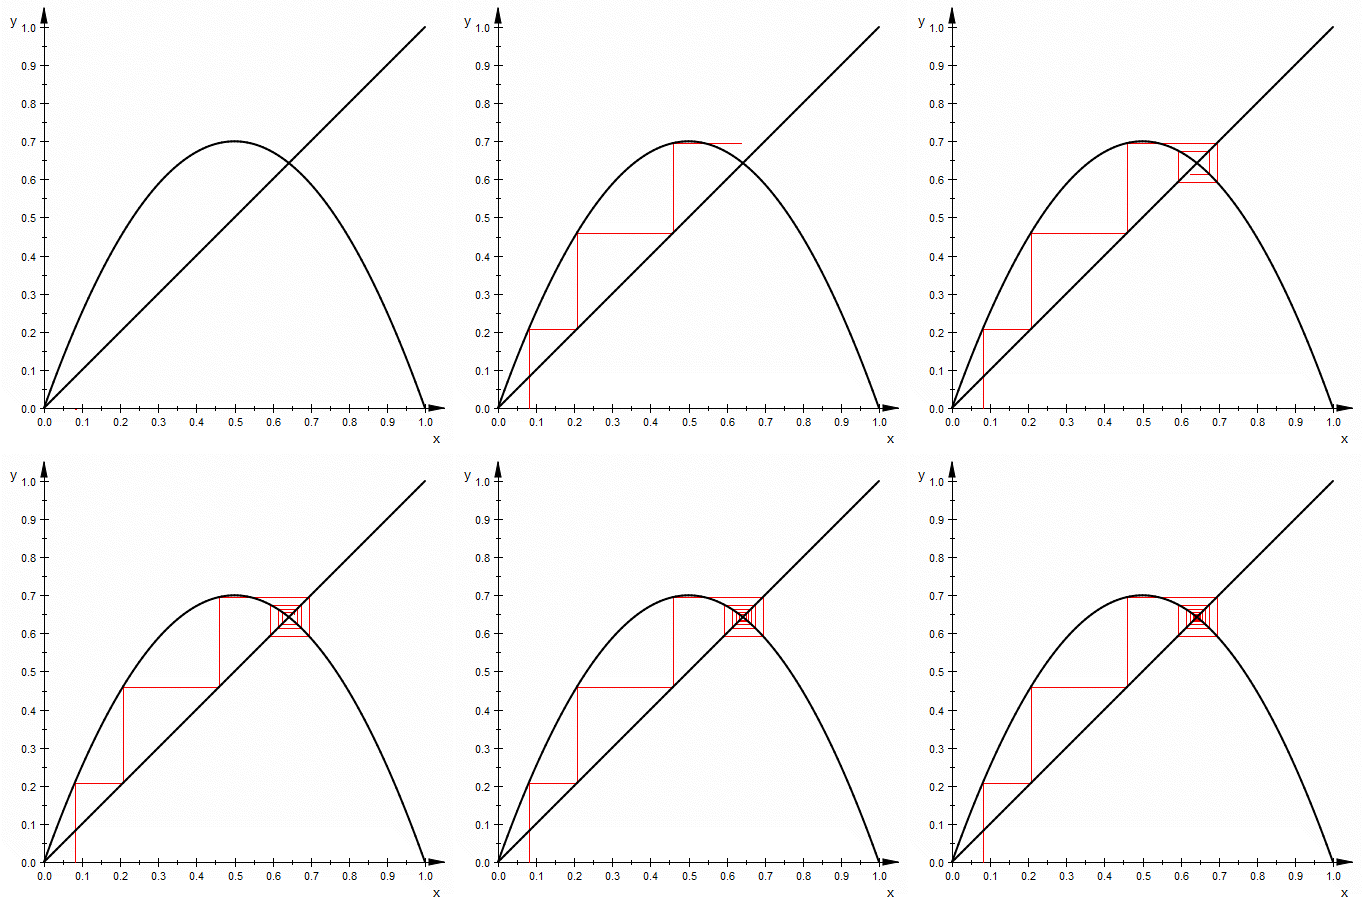
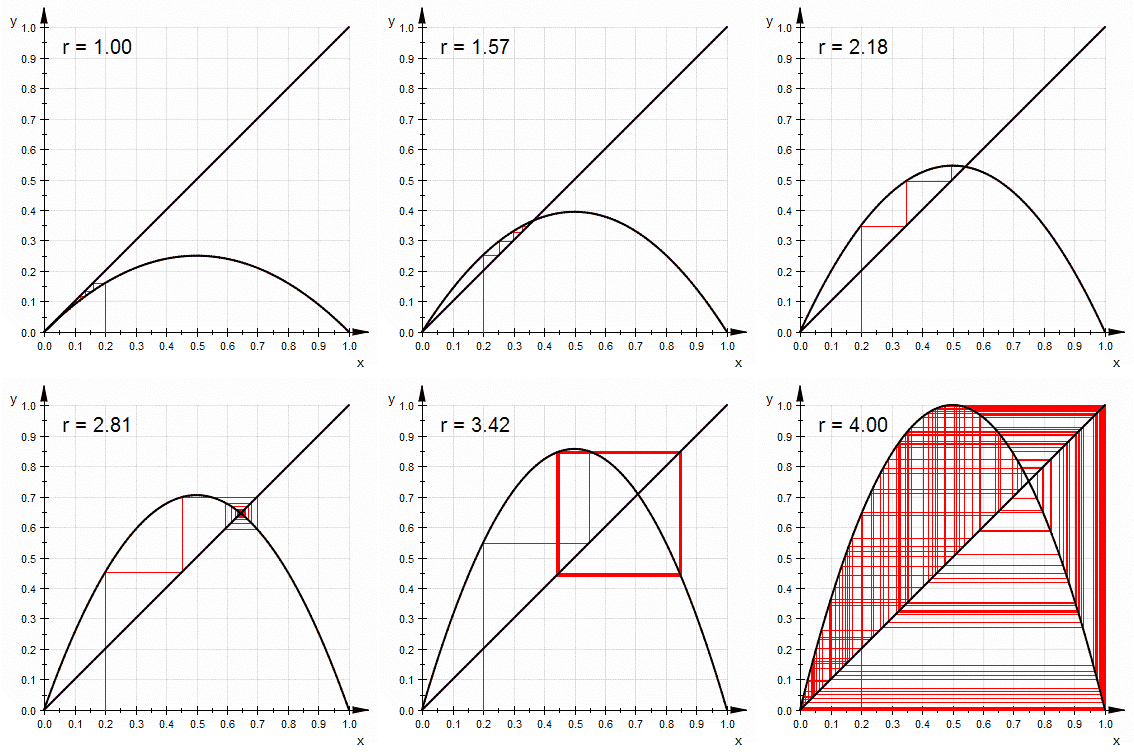
Also worth of mention, for 1-D maps at least, is the cobweb plot, which is essentially a graphical representation of the iteration process that is very useful for gaining an intuition about the process. Wikipedia examples use precisely the logistic map:


