1
$\begingroup$

The standard model of cosmology indicates that the total mass–energy of the universe contains 4.9% ordinary matter, 26.8% dark matter and 68.3% dark energy.

For the standard cosmological model, the observable horizon has a total comoving volume of $12150$ cubic Gigaparsecs. That is our potentially observable universe, and is known as the Hubble volume. The deepest observation with an optical telescope is the Hubble Ultra Deep Field, which has confirmed galaxies out to redshift of $10$. Plugging this to the cosmological model, we get a comoving volume within this redshift of $3776$ cubic Gigaparsecs, which corresponds to roughly 30% of the Hubble volume.

Hence when we can observe only $\approx{27.8}$% of our universe how can we Calculate the percentage contribution of matter? With that said how do we calculate the percentage contributions of dark matter and dark energy?

Note: Related question: How do people calculate proportions of dark matter, dark energy and baryonic matter of the universe?. This question is to do with how the actual calculations were done, but my question is to do with how could these calculations be done when our observation of the universe is limited.

$\endgroup$
1
  • 3
    $\begingroup$ The obvious approach is 'look at the bit of the universe we can see and assume that the bits we can't are similar'. This is a reasonably straightforward application of the cosmological principle. $\endgroup$
    – user107153
    Commented Nov 28, 2016 at 17:13

1 Answer 1

1
$\begingroup$

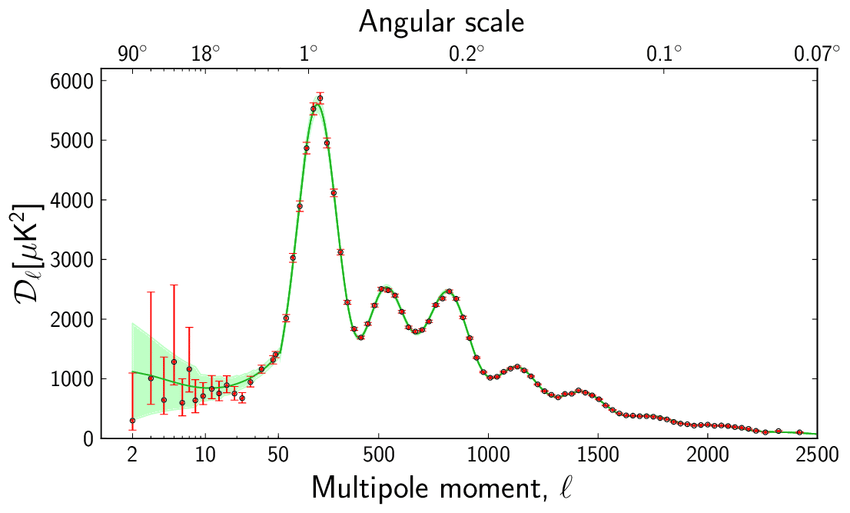
The discovery of CMB (cosmic microwave background) is of great importance. It is the radiation from a very young universe, just when neutral Hydrogen could form. CMB map is basically a map of intensity of this primordial radiation from different sections of the sky. The difference between the intensities of two different parts of the sky give something called as "Power Spectrum". Which can be seen below.

The peaks of the spectrum tells us about the history of Universe. It looks like a damped oscillation, in which case the peaks had to be monotnically decreasing. But we see that some peaks are alleviated (for example, the third peak) which puts a constrain on the percentage of amount of Dark matter in the Universe. Similarly, we fit using Monte-Carlo codes, to get the best fit of data. Hence we can know to a good precision what should be the amount of matter, dark energy, dark matter etc should be there. From a similar analysis of Supernova (TypeIa) data we can also limit the distribution of energy densities to various factors.

CMB helps us to put constraints on various degrees of freedom (for example: number of species of neutrinos and their masses etc) which otherwise seems impossible. The number densities are very easy to calculate from the background temperature. With CMB temperature at present times being 2.7K, the number density of CMB photons turn out to be 300 per cubic centimetre. The neutrino Background similarly, is 1.9K and is also roughly of the same number density. CMB power Spectra

Here is a link for a very primitive exercise which I created to show how things work. Here I have used Supernova data from Supernova Cosmology Project. (https://github.com/BhuvanamProject/MCMC)

$\endgroup$

Your Answer

By clicking “Post Your Answer”, you agree to our terms of service and acknowledge you have read our privacy policy.

Not the answer you're looking for? Browse other questions tagged or ask your own question.