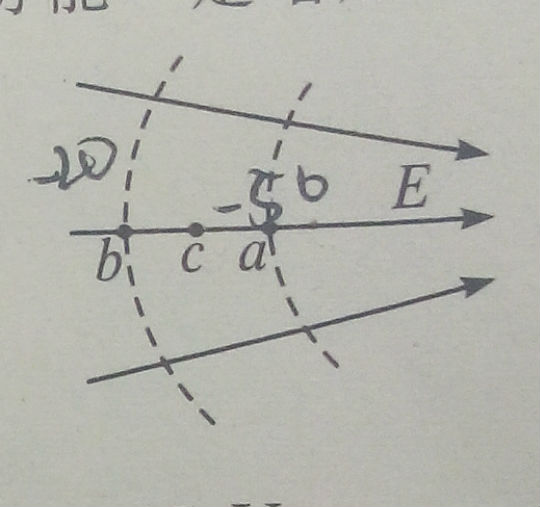
The electric field lines are getting closer together towards the right and this tells you that the magnitude of the electric field is larger on the right than on the left.
That being so and the electric filed $E$ being related to the potential gradient $\frac{dV}{dr} = - E$ means the magnitude of the potential gradient is not constant as one move from left to right.
To get $-35$ volts you assume that the potential in the middle is the average of $-2-$ and $-35$ volts ie assume a constant potential gradient.
If the electric field is due to a point charge then the potential will change in proportion to the reciprocal of the distance from the point charge.
So imaging that you are going down a hill starting at $b$ at a height of $20$ metres below the summit with the downward slope getting greater and greater as you reach $a$ which is $50$ metres below the summit.
How far hove you dropped when you reached $c$?
It might help you to draw a sketch graph of height (potential) against position showing this increased downwards steepness going from $b$ to $a$?
On the sketch graph for comparison draw a straight line which would represent a constant potential gradient.
If you assume that $V \propto \frac 1 r$ where $r$ is the distance from the point charge then you can get a numerical value to your problem.
Start with $-50 = \frac {K}{r_1}$ where $K$ is a constant and $r_1$ is the distance of $a$ from the point charge.

