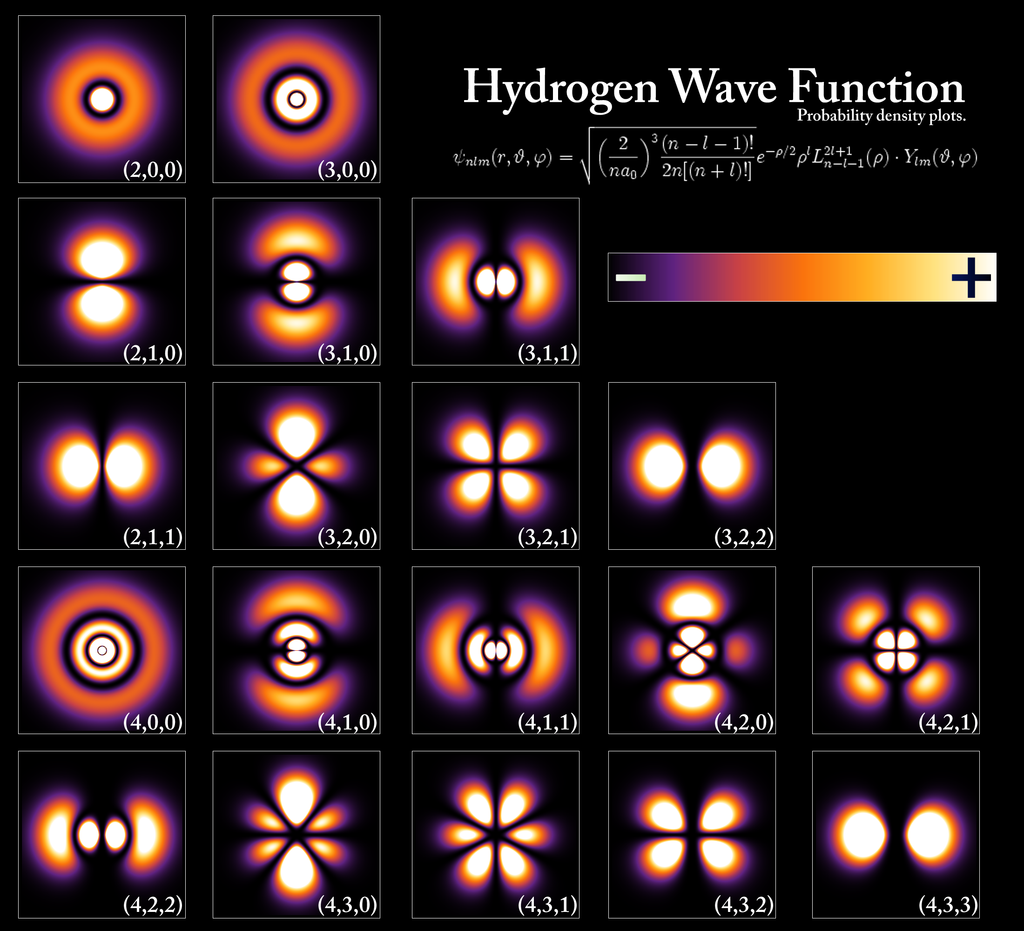
For example, this one:
I'm familiar with probability density functions, basic quantum mechanics, however, I don't know how to make sense of the chart. Specifically:
- Are the three numbers in the lower-right corner quantum numbers?
- What does each shape 'mean'/represent?
- It seems there are ~4 general "types/categories" of charts: concentric circle-type, reproducing cell-type, flower-type, pac-man-type (I hope these are easy to spot). Do members of each type/category share underlying properties?
- Is there a 'straightforward' relationship between the numbers and the shapes? Alternatively, is there a general principle that explains the relationship between the numbers and the shapes, such that knowing that principle (without rote memorization), you can tell roughly which numbers belong to each shape?
- How are these charts used, in current scientific inquiry (be it theoretical or in application)?
In short, what meaning/content do these graphics convey, and what application (if any) does this have?

