0
$\begingroup$

I've done experiments on the thermo-viscoelasticity of liver tissue and the following results

temp shift
1   20     4
2   30     8
3   40    20
4   45    49
5   50   300
6   55  8000
7   60 60000
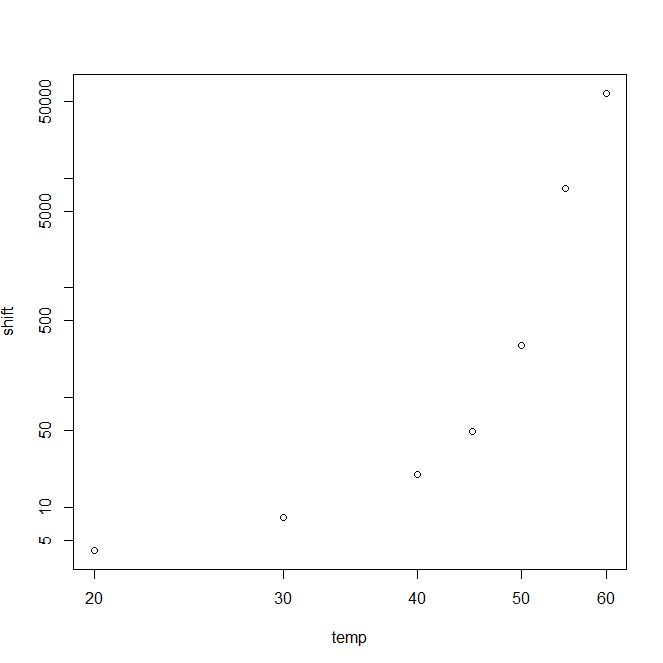
shift vs temp plot
(source: npage.de)
.

show a curved line in a loglog-plot, which means I can't use a power-law function to approximate my data.

Do you have any idea what kind of function might work for my data? I've tried superlinear functions of the type y(x) = a^x^b but that doesn't seem to lead to a good fit.

I'm adding a plot of the same data plus 2 additional temperatures (70 and 80).

temp shift

1 20 4

2 30 8

3 40 20

4 45 49

5 50 300

6 55 80000

7 60 600000

8 70 9000000

9 80 9000000
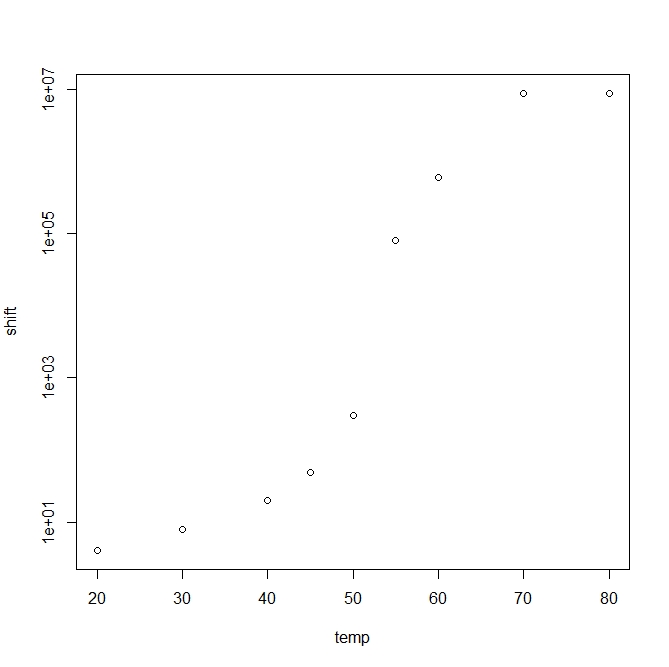
shift vs temp plot
(source: npage.de)
.

$\endgroup$
7
  • 3
    $\begingroup$ I would say that it is definitely not a good idea to 'blindly' fit functions to data without having a clue what you are looking for. You should first form a theoretical expectation/motivation (preferably some sort of derivation) of what kind of relation you might be dealing with. $\endgroup$
    – Danu
    Commented Mar 13, 2014 at 10:47
  • $\begingroup$ Why log-log plot? Did you try linear scale for temp? $\endgroup$ Commented Mar 13, 2014 at 11:39
  • 4
    $\begingroup$ This belongs in Cross-Validated. $\endgroup$ Commented Mar 13, 2014 at 11:54
  • $\begingroup$ @CarlWitthoft (and all the anonymous people who upvoted that comment), if you think so, please flag the question as off topic. Or flag it for moderator attention indicating that you think it's off topic and should be migrated to Cross Validated. $\endgroup$
    – David Z
    Commented Mar 13, 2014 at 20:45
  • $\begingroup$ Interpreting one's data is a basic skill for a experimental scientist. And while it is a little old school, the method of simply trying plots on plain old linear, semi-log and log-log paper is something we used to teach students in introductory labs. $\endgroup$ Commented Mar 14, 2014 at 3:52

2 Answers 2

2
$\begingroup$

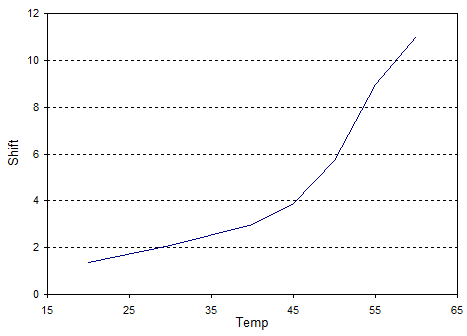
I think you have two distinct thermally activated processes going on here. If I do a log-linear plot of your data I get:

Data

It looks to me as if below 45°C the points lie on a straight line and above 45°C the points lie on a steeper straight line. If I do a linear regression of the points below 45°C and above 45°C I get the fits:

Below 45°C:

$$ S = 0.771 e^{0.0805 T} $$

Above 45°C:

$$ S = 1.16 \times 10^{-9} e^{0.530 T} $$

So over the whole temperature range the shift is given by:

$$ S = 0.771 e^{0.0805 T} + 1.16 \times 10^{-9} e^{0.530 T} $$

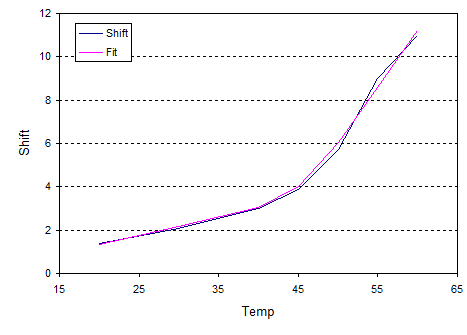
If I graph the data and the fit together I get:

Fit

and this looks a pretty good fit to me.

$\endgroup$
2
  • $\begingroup$ I would add that there probably is valid theoretical basis for splitting the data this way, and I reference what @Danu commented in the OP question. Coming from the idea that organic tissue, especially proteins, would start to have observable and distinct property changes above a threshold temperature--denaturation, folding etc...hypothesise accordingly.. $\endgroup$
    – gregsan
    Commented Mar 13, 2014 at 17:03
  • $\begingroup$ That's a good idea and you are right. The denaturation temperature of liver tissue can be found around 42°C. $\endgroup$ Commented Mar 14, 2014 at 5:56
0
$\begingroup$

What happens at higher temperatures? Is there an upper asymptote? There appears to be an inflection point around temp=53. This is visible on the log-linear plot. I would try fitting a logistic function http://en.wikipedia.org/wiki/Generalised_logistic_curve as the relationship looks more sigmoidal than exponential (assuming the data is accurate).

$\endgroup$
1
  • $\begingroup$ Thank you for the hint. There is indeed an upper asymptote for higher temperatures. I also have data for 70 and 80°C. I'll upload the plot. $\endgroup$ Commented Mar 14, 2014 at 5:53

Your Answer

By clicking “Post Your Answer”, you agree to our terms of service and acknowledge you have read our privacy policy.

Not the answer you're looking for? Browse other questions tagged or ask your own question.