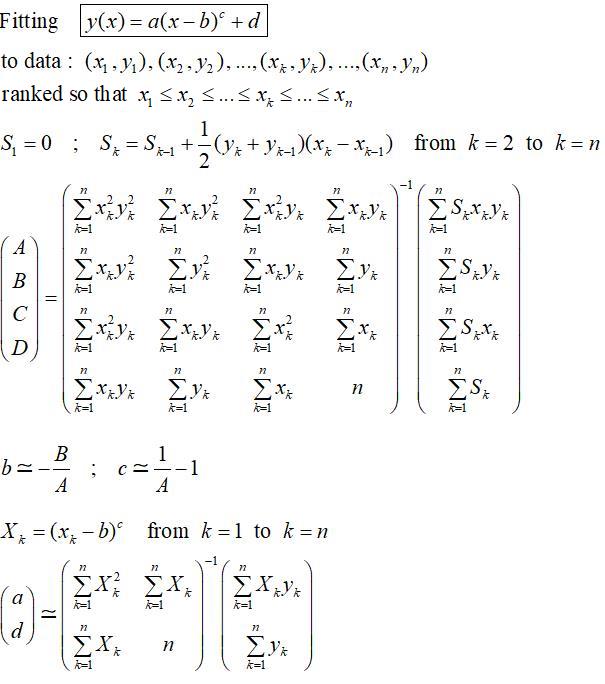
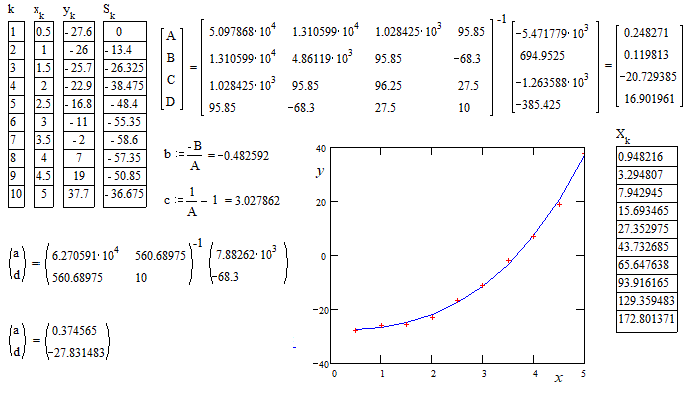
I have some data that I can tell visually that scales like a power law. However, the $x\rightarrow \infty$ and $y\rightarrow \infty$ asymptotes of the data are nonzero. I should thus fit the data to something of the form
$$y=a(x-b)^c+d$$
I am trying to do this with Matlab's curve fitting tool, which can do nonlinear least squares fitting. However, this fails horribly, as the fit converges to a curve that looks nothing like the data (often a stright line), with the fitted values of $b$ and $d$ completely off from what I can tell from the data. The confidence interval for coefficients are also horrible, spanning multiple orders of magnitude.
I have tried guessing $b$ and $d$ and then fitting $y=ax^c$, but this seems to depend sensitively on my choice of $b$ and $d$, where a small change in their values make the fit significantly better or worse.
Why is fitting $y=a(x-b)^c+d$ so problematic numerically? What is the right way of doing this fit?


