I'm new to quantum physics, but as far as I've understood, electron orbitals are defined as the region where an electron has a 90% probability to be. Unless I'm wrong, every point has some probability for an electron to be there, so why did we choose the points as they are, and not in a different way with a different shape made up of a different set of points that also encompasses a 90% probability of an electron being there?
-
$\begingroup$ As far as I understand, in quantum mechanics, as counterintuitive as it can be, there is not even a probability of the electron being there but only a density of a probability function. And as long as the electron is not observed it is everywhere. Really counterintuitive, but that's quantum mechanics. $\endgroup$– Gyro GearlooseCommented Nov 1, 2023 at 18:15
-
1$\begingroup$ Just to clarify, are asking why we conventionally choose to draw a shape that is the smallest shape that integrates to 90% of the probability density and not some other piecemeal shape with holes in it that also integrates to 90% of the probability density? $\endgroup$– hftCommented Nov 1, 2023 at 19:59
-
1$\begingroup$ Does this answer your question? Atomic orbitals $\endgroup$– Matt HansonCommented Nov 1, 2023 at 22:42
-
1$\begingroup$ I find it amazing that somebody voted to close this question for not being clear. I would suggest reading the questions more carefully. $\endgroup$– GiorgioP-DoomsdayClockIsAt-90Commented Nov 1, 2023 at 23:04
-
1$\begingroup$ @GiorgioP-DoomsdayClockIsAt-90 well… we’re gonna have to agree to disagree but I’ve never heard of orbitals as defined in terms of 90% or any percentage of anything. Maybe it just shows my age…. At any rate the question is reopened. $\endgroup$– ZeroTheHeroCommented Nov 2, 2023 at 15:27
5 Answers
electron orbitals are defined as the region where an electron has a 90% probability to be.
I know this is quite a widespread definition. Unfortunately, it is completely wrong. Let me explain why, and after, I'll discuss their shape.
Definition of orbital
Although the definition of orbitals and even fields as the region of space such... has been used in the history of Physics by famous scientists, it is mathematical and physical nonsense. The reason is simple. An orbital can be represented by positive, negative, and even complex numbers. Do we know negative or complex regions of space? We add the values of overlapping orbitals. Do we add overlapping regions of space?
An orbital is actually a one-particle wavefunction, say $\psi({\bf r})$, in general complex, with the three-dimensional space as its domain. Its relation with probabilities is that the integral of $ |\psi({\bf r})|^2$ over every three-dimensional volume gives the probability of finding an electron in that region of space.
Therefore, at best, the usual definition is missing some important additional words. For example, we could say consistently that, among many different ways of representing an orbital, we can choose to use the boundary surface of the region of space where there is a given percentage of finding one electron (not necessarily $90\%$, another frequently chosen threshold is $95\%$). For example, by selecting the threshold of $90\%$ of probability, we are using as a visual representation of an orbital $\psi({\bf r})$ the surface delimiting the three-dimensional volume $V$ such that $$ \int_V |\psi({\bf r})|^2 d^3{\bf r}= 0.9.\tag{1} $$
Of course, and I think this is your main concern, equation ($1$) does not uniquely identify a region of space. Then, some additional specifications should be added. Actually, the generally used convention is that the encompassed region is the region obtained by considering the three-dimensional volume we get by adding shells of decreasing probability density starting from the absolute maximum. In this way, the boundary surface of the volume is an iso-$ |\psi({\bf r})|^2 $ surface containing all the points where the square modulus of the wavefunction is higher.
Notice that this remains a possible way to get an idea of the shape of an orbital, but it does not coincide with the orbital. Surfaces are finite and limited, while orbitals are extended everywhere. Moreover, the definition based on a given probability level implies that one is using the modulus squared of the orbital instead of the orbital itself.
Notice that, due to many different conventions that may be used to provide a graphic representation of an orbital, it is advised to look for a clear definition of the convention used when looking at pictures of orbitals.
Shapes
The shapes of the orbitals are a consequence of the way the wavefunction depends on the electronic coordinates at fixed nuclear positions. They may vary greatly depending on the kind of orbitals (think, for example, the huge variety of molecular orbitals). Probably the simplest cases of orbitals are the hydrogenoid atomic orbitals that are tabulated and graphically represented in many ways.
...as I've understood, electron orbitals are defined as the region where an electron has a 90% probability to be. Unless I'm wrong, every point has some probability for an electron to be there, so why did we choose the points as they are, and not in a different way with a different shape made up of a different set of points that also encompasses a 90% probability of an electron being there?
The choice of "90%" is arbitrary, and is used just to have some number that is close to 1 so that your book can draw pictures of the orbitals (or pictures of the probability density, which is the absolute square of the orbital).
The actual functional form of the orbitals comes from solving the Schrodinger equation for the Coulomb potential. The picture from the previously-linked page is linked again here.
The term "orbitals" just refers to solutions to the Schrodinger equation, which are provide on the linked page and are reproduced below for completeness: $$ \psi_{n \ell m} = R_{n \ell}(r)\, Y_{\ell m}(\theta,\phi)\;, $$ where $$R_{n \ell} (r) = \sqrt {{\left ( \frac{2 Z}{n a_{\mu}} \right ) }^3\frac{(n-\ell-1)!}{2n{(n+\ell)!}} } e^{- Z r / {n a_{\mu}}} \left ( \frac{2 Z r}{n a_{\mu}} \right )^{\ell} L_{n-\ell-1}^{(2\ell+1)} \left ( \frac{2 Z r}{n a_{\mu}} \right )\;. $$
For example, the "1s" orbital of hydrogen ($Z=1$) is: $$ \psi_{1 0 0}=R_{10}\frac{1}{\sqrt{4\pi}} $$ $$ =\sqrt {{\left ( \frac{2}{a_{\mu}} \right ) }^3\frac{1}{2} } e^{- r / {a_{\mu}}} \frac{1}{\sqrt{4\pi}} $$ in the above notation. The 1s orbital is particularly simple, since the angular dependence is trivial.
The 1s probability density is: $$ \rho_{1s} = |\psi_{100}|^2 ={\left ( \frac{2}{a_{\mu}} \right ) }^3\frac{1}{2} e^{- 2 r / {a_{\mu}}} \frac{1}{{4\pi}} $$
Update:
It is certainly possible to try and show different shapes of different volumes encompassing 90% of the probability density.
It's just that we usually draw the shapes to show the smallest region that gives us 90% of the probability density. This is easier to visualize since such a shape doesn't have holes in it, and therefore it is more meaningful to just show the outer boundary of such a shape.
Regarding whether or not the conventional pictures of "orbitals" (or more likely, pictures of probability density) can be the "smallest," consider the following argument (please note, this is not a generally applicable argument for why or how our conventional pictures of orbitals show the smallest volumes, it is just an argument for why this is the case in some simple situation):
Suppose that the volume of integration is changed such that instead of integrating over some volume $$ \Delta V $$ we integrate over some different volume: $$ \Delta V' = \Delta V + \delta V_2 - \delta V_1\;. $$
Consider small changes, such that the change in probability is: $$ \delta \rho = \delta V_2 \rho(\vec r_2) - \delta V_1 \rho(\vec r_1)\;. $$
But this change must be zero, since we are demanding that the total integrated probability density is always some fixed value, like 0.9.
Thus: $$ \delta V_2 \rho(\vec r_2) = \delta V_1 \rho(\vec r_1) $$ and $$ \Delta V' = \Delta V +\delta V_1 \left(\frac{\rho(\vec r_1)}{\rho(\vec r_2)}-1\right) $$
So, $\Delta V'$ will be bigger than $\Delta V$ whenever: $$ \rho(\vec r_2) < \rho(\vec r_1)\;, $$ which means that as long as we are integrating where the probability density is largest we will end up with a shape that is smallest.
For the 1s density this means we start at the smallest possible $r$, which is zero, and integrate out continuously (since the density decreases monotonically) to a single fixed radius $R$.
-
1$\begingroup$ "The choice of "90%" is arbitrary" --- yes, but I think this misses the OP's point. There are multiple (overlapping) regions that satisfy the 90% criterion. The question is, when the standard pictures are drawn, what additional criterion is being used to choose among these? Perhaps your equations answer that question implicitly, but I think the OP is looking for a clear conceptual explanation of how one region is chosen over another. $\endgroup$– WillOCommented Nov 1, 2023 at 18:32
-
$\begingroup$ Hmm. Ok. Yeah, that's a strange/worse question, but I can address that... $\endgroup$– hftCommented Nov 1, 2023 at 19:51
-
1$\begingroup$ Your update seems to me to be exactly what the question was asking for, while all of the other answers ignore the question entirely. Thank you. $\endgroup$– WillOCommented Nov 1, 2023 at 22:22
-
$\begingroup$ @WillO I don't think people are ignoring "the question," per se. The title question is simply: "Why are electron orbitals shaped how they are?" This is likely what most answers (including mine) are focused on. $\endgroup$– hftCommented Nov 1, 2023 at 22:39
-
1$\begingroup$ @hft your argument convinces me that isosurface contours are surfaces of minimal volume for a fixed probability enclosed. If you want zero probability enclosed then you can pick the global maximum. If you want a little bit more probability while gaining minimal volume you should add a set of points with the highest possible probability. This will leave you with an isosurface contour. If you want to increase enclosed probability while minimizing volume you will greedily collect points with the highest probability so that you get minimal volume. This will leave you with isosurfaces. $\endgroup$ Commented Nov 4, 2023 at 18:35
An atomic orbital is a complex function of 3D space, $\psi(x, y, z) = \psi(r, \theta, \phi)$. It is challenging to visualize 3D functions. One way to do so is to calculate the probability density $P(x, y, z) = |\psi(x, y, z)|^2$ and plot isosurface contours of $P(x, y, z)$, that is surfaces in 3D space on which $P(x, y, z) = c$ for some constant number $c$. Note that for every value of $c$ the corresponding isosurface contour "contains" a total probability $$ \text{Prob}(P(x, y, z) <= c) = \int_{|\psi(x, y, z)|^2<=c} |\psi(x, y, z)|^2 dV = p_c $$ (Note that the integration bound here is very strange. we cannot analytically calculate $p_c$ from $c$ or vise-versa, but the calculation can be done numerically without too much trouble.)
The OP seems to suggest that, when atomic orbitals are visualized, we typically choose $c$ so that $p_c=0.9$. The OP is correct that when visualizing atomic orbitals using isosurface contours we do have to choose some value for $c$ (and correspondingly a value for $p_c$). But the OP is incorrect that there is any standardized value chosen for $p_c$ across all references. See e.g. This orbital n=4, l=1, m=1 orbital on Wikipedia shown with $p_c=0.45$ (or orbital in my profile pic which shows $(n, l, m)=(4, 3, -1)$ with $p_c=0.6$). I also would suggest that $p_c=0.9$ is an uncommon value to select for $p_c$. As we'll see below, $p_c=0.9$ contains "too much" probability so that the orbitals look very "fat" and it's hard to see the geometric features of the orbital as clearly. I've found $p_c=0.6$ to be a good value for visualizing lots of different orbitals.
The OP asks:
why did we choose the points as they are, and not in a different way with a different shape made up of a different set of points that also encompasses a 90% probability of an electron being there?
The answer is that, once a probability threshold $p_c=0.9$ is selected, the wavefunction magnitude threshold $c$ such that $p_c=0.9$ is uniquely selected. The isosurface contour is then, again, uniquely selected by $|\psi(x, y, z)|^2 = c$. Most succinctly: When we see isosurface contour visualizations of atomic orbitals, those surfaces are selected so that $|\psi(x, y, z)|^2$ is constant on the surface, this is the definition of an isosurface contour.
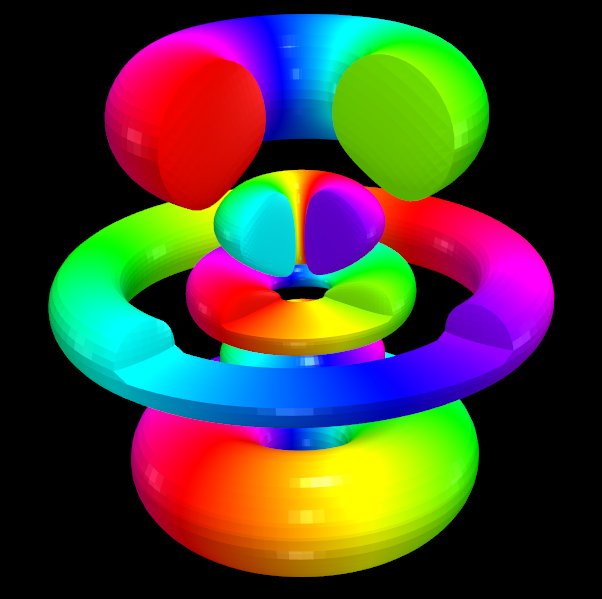
Note that in addition to visualizing the probability $P(x, y, z)$ we can also visualize the phase of the wavefunction $\text{arg}(\psi(x, y, z))$ by coloring the portion of the isosurface contour so that the color hue maps to the wavefunction phase. i.e. phase of 0 shows up as red, phase of $\pi/2$ shows up as green, phase of $\pi$ shows up as blue, and phase of $3\pi/2$ shows up as purple. For the complex orbitals which are eigenvectors of the $L_z$ operator, this results in beautiful rainbow colored rings. for real orbitals (orbitals which are the real and imaginary parts of the complex orbitals that we often see in intro chemistry or quantum physics textbooks) this corresponds to red and blue lobes depending on whether the wavefunction is locally positive or negative.
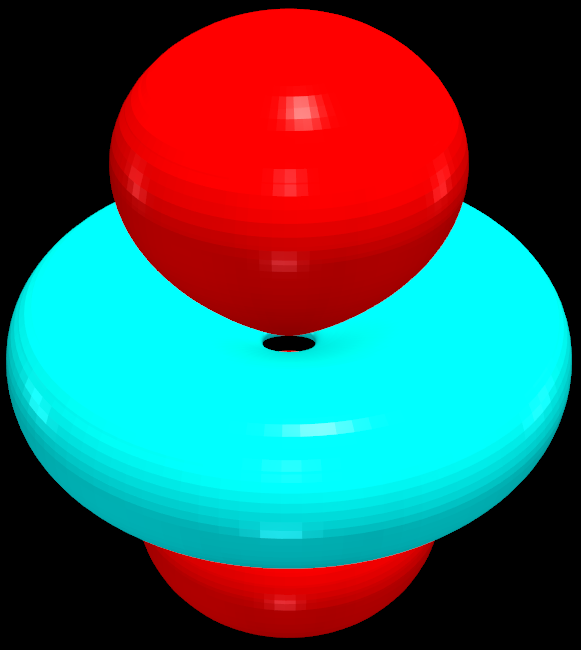
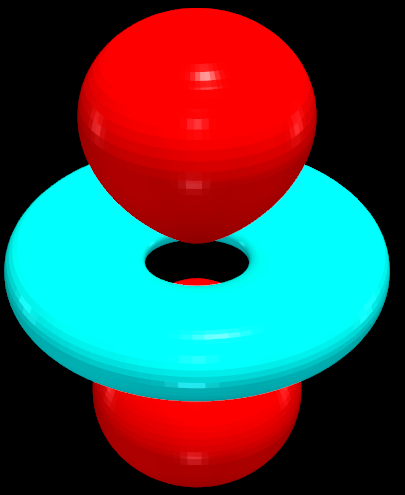
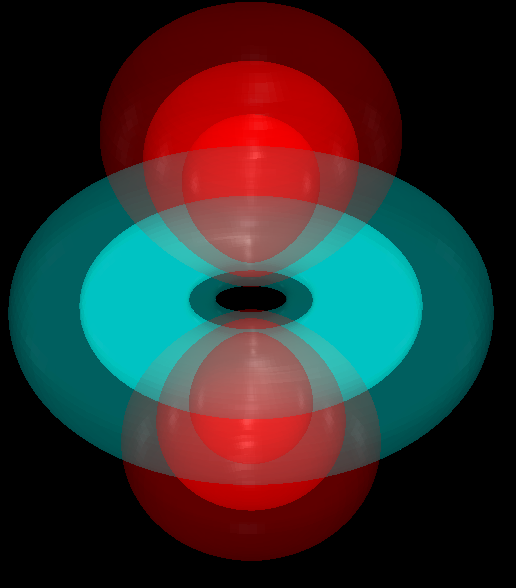
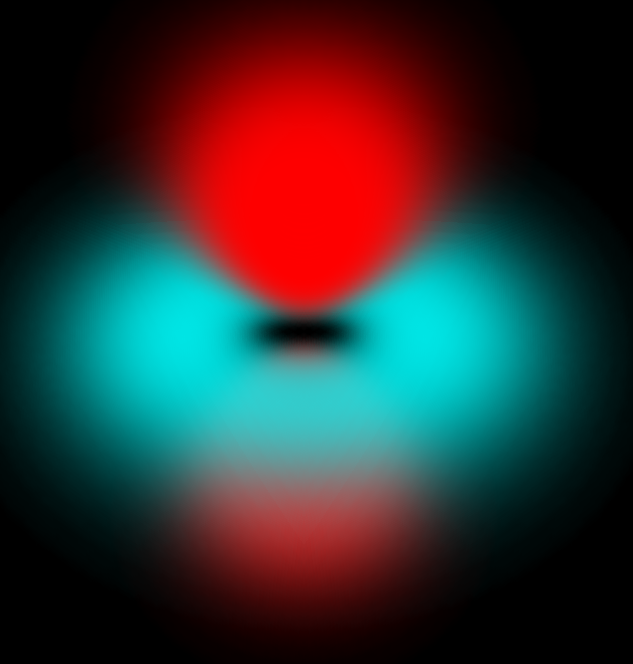
Here are some isosurface contour visualizations of the $(n, l, m) = (3, 2, 0)$ orbital.
$p_c=0.9$:
$p_c=0.6$:
We can make the orbitals transparent with an opacity proportional to $c$ (so that more probable isosurface contours are more opaque). Below we use this technique with $p_c=0.2, 0.5, 0.8$:
Note, importantly, that we see 3 red isosurfaces, one for each probability threshold, but only 2 blue isosurfaces. This is because, at the $p_c=0.2$ level, the blue lobe is too un-probable! Thus, care must be taken to not choose a value of $p_c$ that is too low otherwise you run the risk of missing certain lower probability lobes. However, other than this constraint, we can see that the qualitative features of the orbital do not depend on the exact value chosen for $p_c$. This is why there is some "artistic freedom" we can take in selecting $p_c$ for visualizations.
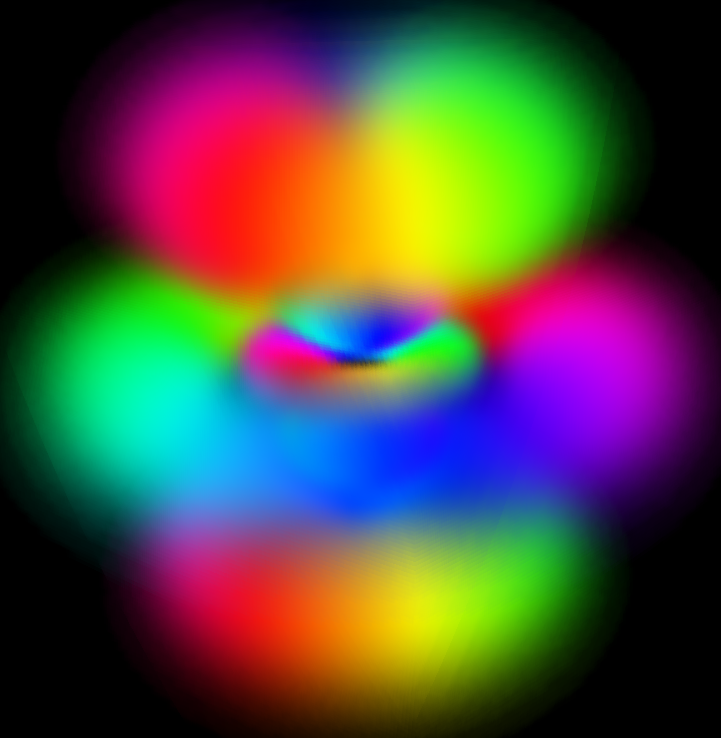
We can side-step the whole issue of selecting a value of $p_c$ by instead visualizing $\psi(x, y, z)$ as a volume cloud. In this strategy we partition space up into small voxels and set the opacity of the voxel to $\Gamma(|\psi(x, y, z)|^2dV)$ where $dV$ is the volume of the voxel and $\Gamma$ is some monotonic but possibly non-linear function that can be used to weight high or low probability regions disproportionately (again, selected based upon some artistic freedom).
Here is $(n, l, m)=(3, 2, 0)$ shown with a max opacity of 1 and a linear opacity function.
Just for fun, since I can't resist sharing these beautiful images, here are some views of the $(n, l, m) = (5, 3, 1)$ orbital. First an isosurface contour with $p_c=0.6$ with the $+x, +y, +z$ cube cutout for clarity
and a cloud volume visualization (max opacity of 1 and linear opacity function)
These images were generated using atomview, a python package I wrote which is a work in progress for me. It is based on pyvista which is a python wrapper around VTK which is itself a 3D graphics visualization framework. See Thaller, Visual Quantum Mechanics and Thaller, Advanced Visual Quantum Mechanics for more details about visualizing 3D wavefunctions, atomic wavefunction, and visualization of other quantum phenomena.
The Schrodinger equations gives a solution for the wavefunction .But the wavefunction is the probability density for a observable of what it describes. From statistics if $L(x)$ is the probability density then the probability of a outcome to be between $x_{1}$ and $x_{2}$ $c=\int_{x_{1}}^{x_{2}}L(x)dx$ , 0<=c<=1.We just set c to 0.9 and find $x_{1}$ and $x_{2}$
-
$\begingroup$ You've given one equation in the two unknowns $x_1$ and $x_2$. The OP is asking how you choose among the various solutions --- or more precisely, how the people who draw pictures of orbitals make this choice. $\endgroup$– WillOCommented Nov 1, 2023 at 18:23
-
-
1$\begingroup$ I do not believe that the pictures the OP is referring to are one-dimensional. I also don't believe they are spherically symmetrical, so the obvious generalization of "$x_2=-x_1$" won't help. $\endgroup$– WillOCommented Nov 1, 2023 at 18:34
-
$\begingroup$ @WillO ok just use a triple integral $c = \int_{r_{1}}^{r_{2}} \int_{\theta_{1}}^{\theta_{2}}\int_{\phi_{1}}^{\phi_{2}}\Psi(r,\theta,\phi) dr d\theta d\phi$ $\endgroup$– CeriseCommented Nov 1, 2023 at 20:24
-
$\begingroup$ Have a look here: en.m.wikipedia.org/wiki/File:Hydrogen_Density_Plots.png The illustrated regions look nothing like the form you're proposing. $\endgroup$– WillOCommented Nov 1, 2023 at 22:19
This visual might be helpful to you. The energy states in an electron behave like the waveforms of the bresonant frequencies of a standing wave. If you have a guitar or violin handy, you can pluck a string and observe the shape and hear the corresponding tone. Pressing your finger on a fret or anywhere on the neck constrains the system differently and causes a different shape (and different tone).
When an electron gains or loses energy, it becomes constrained differently by the force of the nucleus, and so it's waveform shape and size changes. The video linked shows certain waveform shapes for the ring with a basic shape in between resonances. But the electron cannot exist at intermittent energies between resonances, and instead directly jumps between shapes.
The shapes of the orbitals are not arbitrary and cannot be chosen differently. They are (basically) what would happen if you had a totally spherical membrane drum (as opposed to a flat circular disk like most musical drums) and then hit it with some input. It would vibrate in those shapes (spherical harmonics).

