2
$\begingroup$

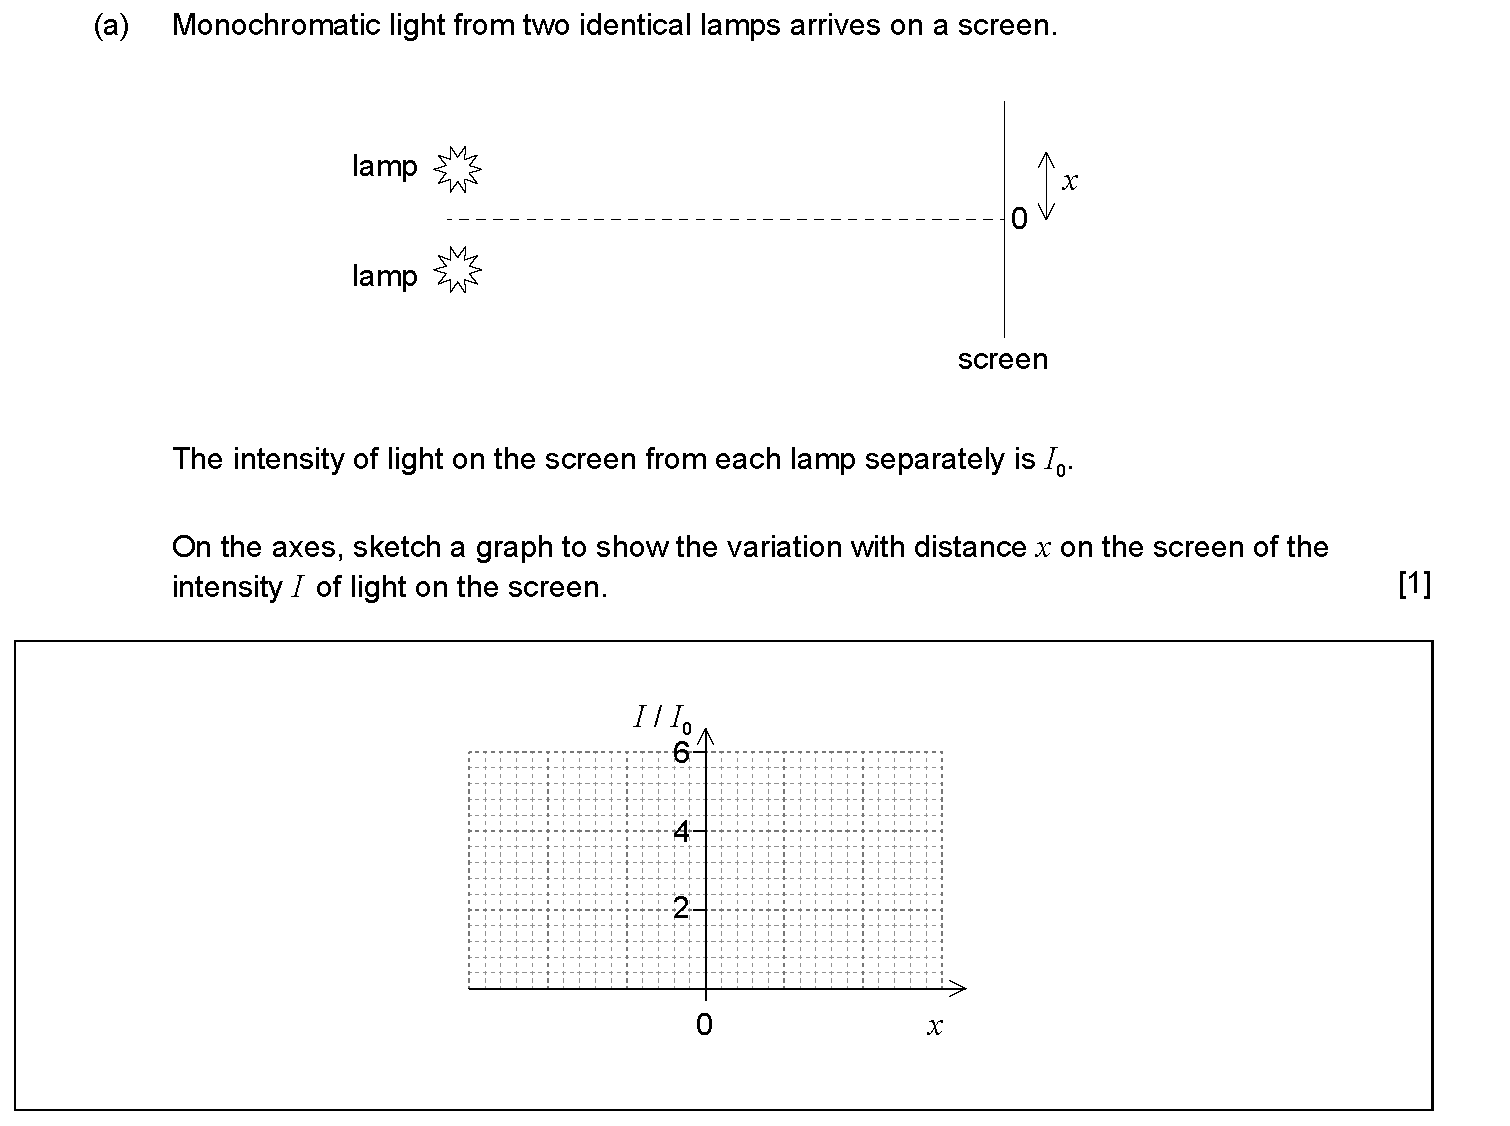
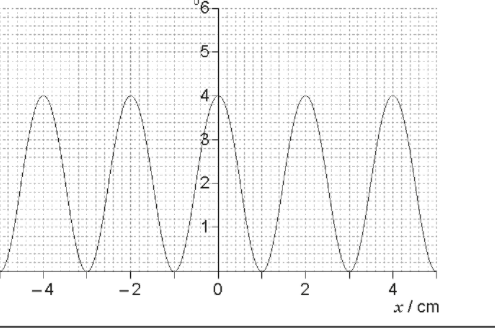
In this question, I assumed that the two sources should act like the two slits in the Double Slit Experiment, and give a graph similar to this:

enter image description here

However, as per the markscheme, the intensity graph is just a straight line, passing through 2$I_0$. I don't understand why, and my teacher also didn't help. Please explain.

Thanks for the help!

Question

Edit

Answer as per the markscheme:

enter image description here

$\endgroup$
3
  • 1
    $\begingroup$ Closely related? Why are two independent sources incoherent? $\endgroup$
    – Farcher
    Commented Apr 25, 2021 at 10:19
  • $\begingroup$ @Farcher yep it is related, for sure. However, it doesn't answer the main question. I would appreciate any help with the reasoning behind the final intensity graph. $\endgroup$ Commented Apr 25, 2021 at 11:22
  • $\begingroup$ The total intensity is the sum of the intensities from the two sources because although over there is superposition of the waves from the two sources the resulting pattern very, very quickly changes to be another pattern. $\endgroup$
    – Farcher
    Commented Apr 25, 2021 at 12:59

2 Answers 2

2
$\begingroup$

The exactly correct answer would not be a perfectly flat line but a slight reduction in intensity at the edges where the screen is further from the sources.

The important point here is hidden in the details of the term "monochromatic". That word means "just one colour" which equates to "single wavelength", but when you have something like a lamp, the waves from different parts of the lamp (e.g. from different atoms) are not in step with one another. There is a random phase shift as you go from one atom to another.

One particular pair of waves, with one particular relative phase, from a given pair of atoms in the two sources, will interfere on the screen and give a pattern of fringes, but the location of the fringes on the screen will be shifted by this random phase. Some other pair of atoms also gives a pattern, but now shifted by some other value of the random phase. If the phases all agreed, you would indeed get a fringes of intensity between zero and $4 I_0$, but since the phases are random all these shifted patterns overlap and fill up each other's gaps, with the result that the overall total intensity is just flat at $2 I_0$.

$\endgroup$
1
  • $\begingroup$ Thank you for the detailed explanation! $\endgroup$ Commented Apr 25, 2021 at 15:46
0
$\begingroup$

Interference happens only for coherent waves. Coherence for light means, that all photons, which all together make up the light, have the same phase. Imagine it like this: Each photon in itself is a very small wave. If the waves are aligned (i.e. they have the same phase), they make one very big wave, which is called coherent light and is produced by lasers. If they are not aligned, the light is incoherent, like from any run-of-the-mill light bulb.

For the double slit, the light that goes through or is emitted at the two slits needs to be coherent to see the interference pattern. This is not the case if you use two different light sources as discussed in this question pointed out in the comments by Farcher. When deriving the light of the two slits from the same laser, it is coherent.

As for the 2I intensity at x=0: this seems to be an approximate answer. For incoherent sources, their intensities are added together. In the approximation that the screen is far enough away from the two sources, and the sources are close together, one sees basically one light source with intensity 2I at x=0 and this is the same for small deviations around x=0. For large values of x, the intensity would drop, but this is just not included in the plot.

Btw, for radio waves, because their frequency is much lower, you can actually have multiple radio emitters that are coherent. By controlling the phase relationship of the emitters and cleverly using the interference between them, one can even give a (near) arbitrary shape to the outgoing wave. This is called a phased array antenna.

$\endgroup$
3
  • $\begingroup$ Thanks for your answer. However, what I don't understand is that even though the sources are indeed incoherent, why is the intensity graph constant at 2I. I edited the question to attach the answer as per the markscheme. $\endgroup$ Commented Apr 25, 2021 at 11:20
  • $\begingroup$ I have edited the answer to include that. Do you want more details on how the intensity would look like without the approximation? $\endgroup$
    – Hannes
    Commented Apr 25, 2021 at 11:38
  • $\begingroup$ Thank you for the detailed explanation! $\endgroup$ Commented Apr 25, 2021 at 15:42

Your Answer

By clicking “Post Your Answer”, you agree to our terms of service and acknowledge you have read our privacy policy.

Not the answer you're looking for? Browse other questions tagged or ask your own question.