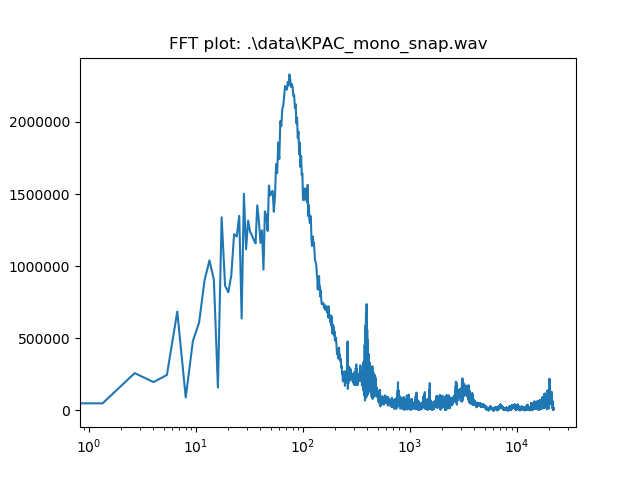
I am trying to write a program that would help me match some small sound. (For e.g. snapping of two fingers in an audio clip). I took a sample with had the desired sound in it, and plotted the frequency distribution (after doing fourier transform on the audio input). I ended up with a graph as follows:

I would want to know what if the snap sound itself got less louder...would the amplitude in the graph belowabove scale down but maintain the general shape?
Secondly, what does it mean if such a distribution "shifts", say, to the right, but maintains the same "shape"? In this case, can we conclude that it is the same sound?
Ps: although I say "shape" they look erratic yet they have a pattern to it. This will be more visible in the animation I shall post in a short while.. This will be more visible in the animation I shall post in a short while.... https://youtu.be/bMYYZ6eGgsc
