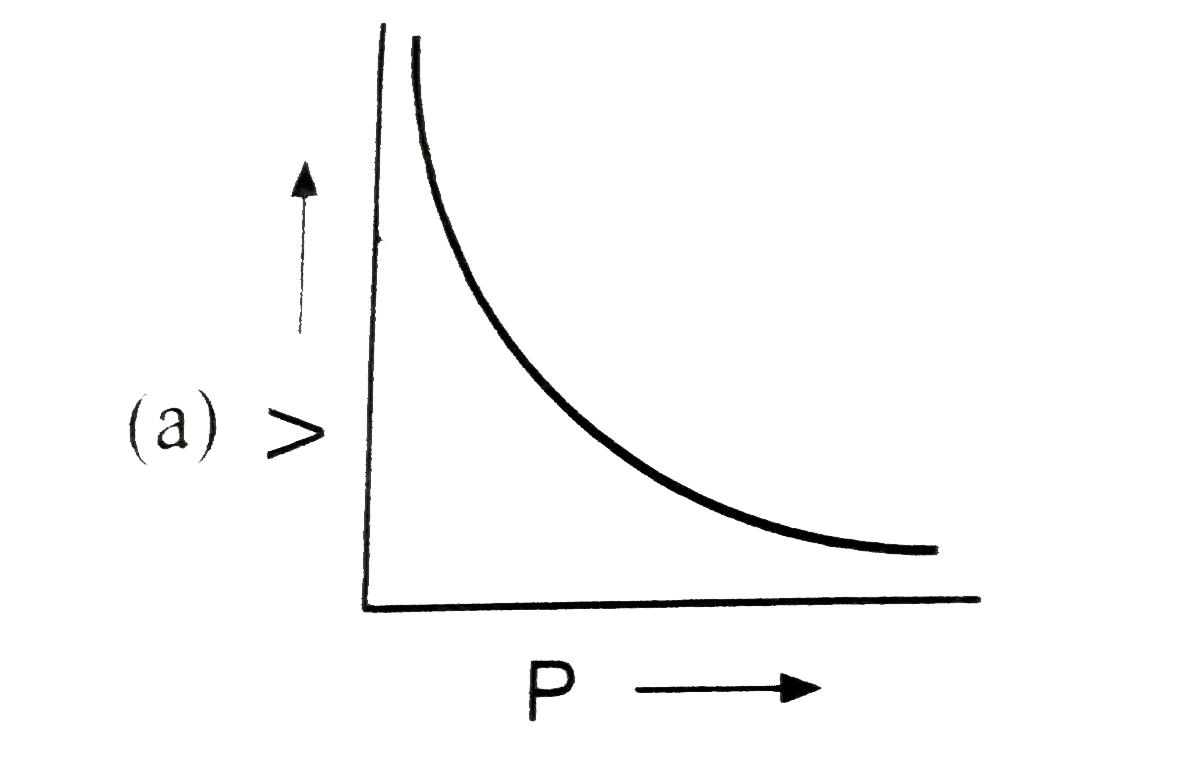
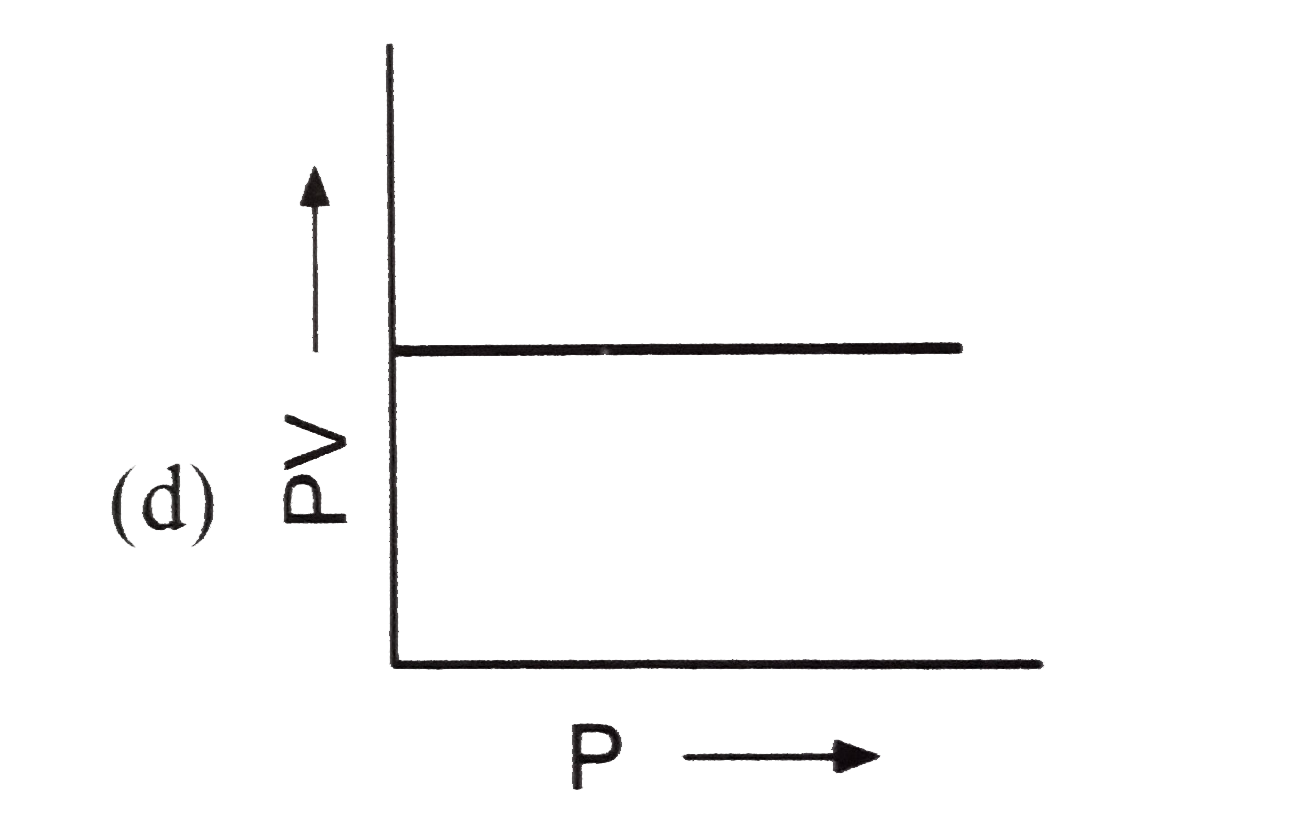
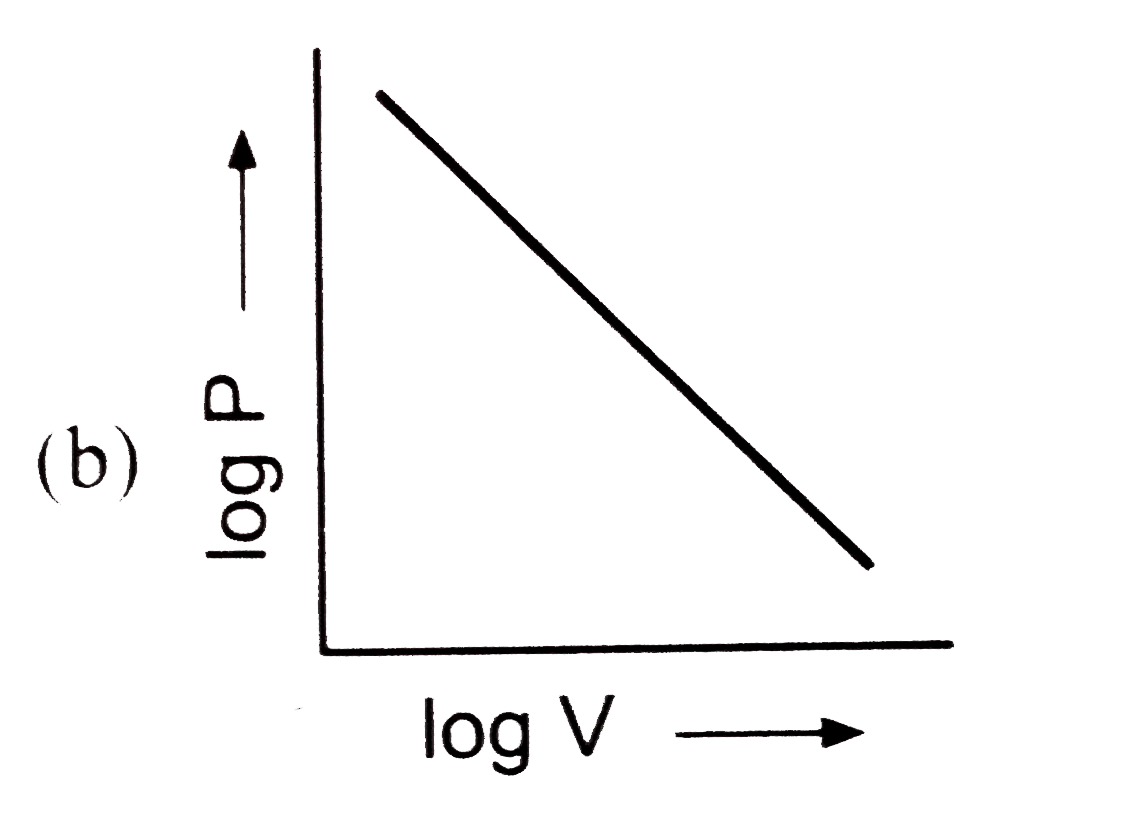
The graphs below shows three conventional ways of graphically presenting Boyle's law. As observed from the graphs below, the pressure increases with a decrease in volume, and vice versa. Pressure is inversely proportional to volume, so other parameters (temperature and amount of gas) are constant.    Charles's law states that the volume of a gas increases with the temperature, and vice versa. The graphs below shows four conventional ways of graphically presenting Charles's law. Volume is directly proportional to temperature at a constant pressure, [![enter image description here][1]][1] [![enter image description here][2]][2] [1]: https://i.sstatic.net/JC4MJ.png [2]: https://i.sstatic.net/8oLcl.png