This is a supplement to the answer by @PhilipWood.
An interactive graph can help you visualize what is happening. Here's what I wrote for my class.
Helmholtz Coils (robphy) - superposition
https://www.desmos.com/calculator/qbszpfbdgr
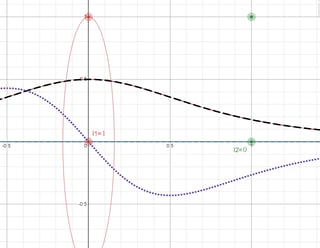
For one loop of radius $R$ and current, here's the field strength (dashed) and its derivative (dotted):
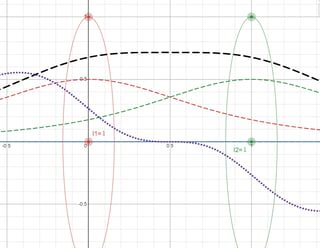
For an identical loop and oriented-current but translated along the axis by a distance $R$, we have, by superposition,
For the best uniform field near the midpoint, we want the flattest graph of $B_z$ near the midpoint.
- Notice how flat the derivative $\frac{dB_z}{dz}$ is near the midpoint of the loop-centers.
For identical loops and currents, by symmetry, regardless of the separation, the odd derivatives are zero.
- The first derivative being zero says $B_z$ is a local extremum.
- Although the third derivative zero, the second-derivative is not generally zero. It turns out (by calculation) that the second-derivative is zero when the separation is equal to $R$. (When this is achieved, you have to go to the 4th derivative to get something nonzero.)
- Play around by changing [by dragging control points] the separation between the centers [and by changing the radii] to see a sub-optimal configuration.
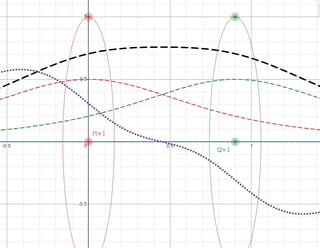
Here is it with separation $0.9R$.
$B_z$ still looks approximately constant near the midpoint, but not as good as when the separation is $R$.
Similarly, with the desmos visualization I wrote, you could also study
- the setup for an optimal uniform-gradient by flipping the direction of one current. (You have open the "derivatives" folder and display the plot of the second-derivative... then zoom out to appreciate the variations.)
- the setup for the Maxwell coil.


