Ah, I know this one!
What's in a proton?
A proton is really made of excitations in quantum fields (kind of like localized waves). Remember that. Any time you hear any other description of the composition of a proton, it's just some approximation of the behavior of quantum fields in terms of something people are likely to be more familiar with. We need to do this because quantum fields behave in very nonintuitive ways, so if you're not working with the full mathematical machinery of QCD (which is hard), you have to make some kind of simplified model to use as an analogy.
One of the more confusing things about quantum field excitations is that they react differently depending on how they are observed. More specifically, the only way to measure the properties of an excitation in a quantum field is to make it interact with another excitation and see how the excitations affect each other. Or in particle language, you have to hit the particle with another particle (the "probe") and see what comes out. Depending on the charge, energy, momentum and other properties of the probe, you can get various results.
People have been doing this for decades, and they've compiled the results into a few general conclusions. For example, in a slow collision, with very little energy involved, a proton acts like a single point particle. If we give the particles slightly more energy, the proton looks more like a blob with three points in it --- this is part of why it's often said that the proton consists of three quarks. (Incidentally, the reason you see images like the one you found on Wikipedia is that for a long time, people were colliding protons at the intermediate energies where they appear to behave as a group of three quarks.) If we give the colliding particles even more and more energy, the proton will appear to be an ever-more-dense amalgamation of all sorts of particles: quarks, antiquarks, gluons, photons, electrons, and everything else. We call these particle partons (because they're part of the proton).
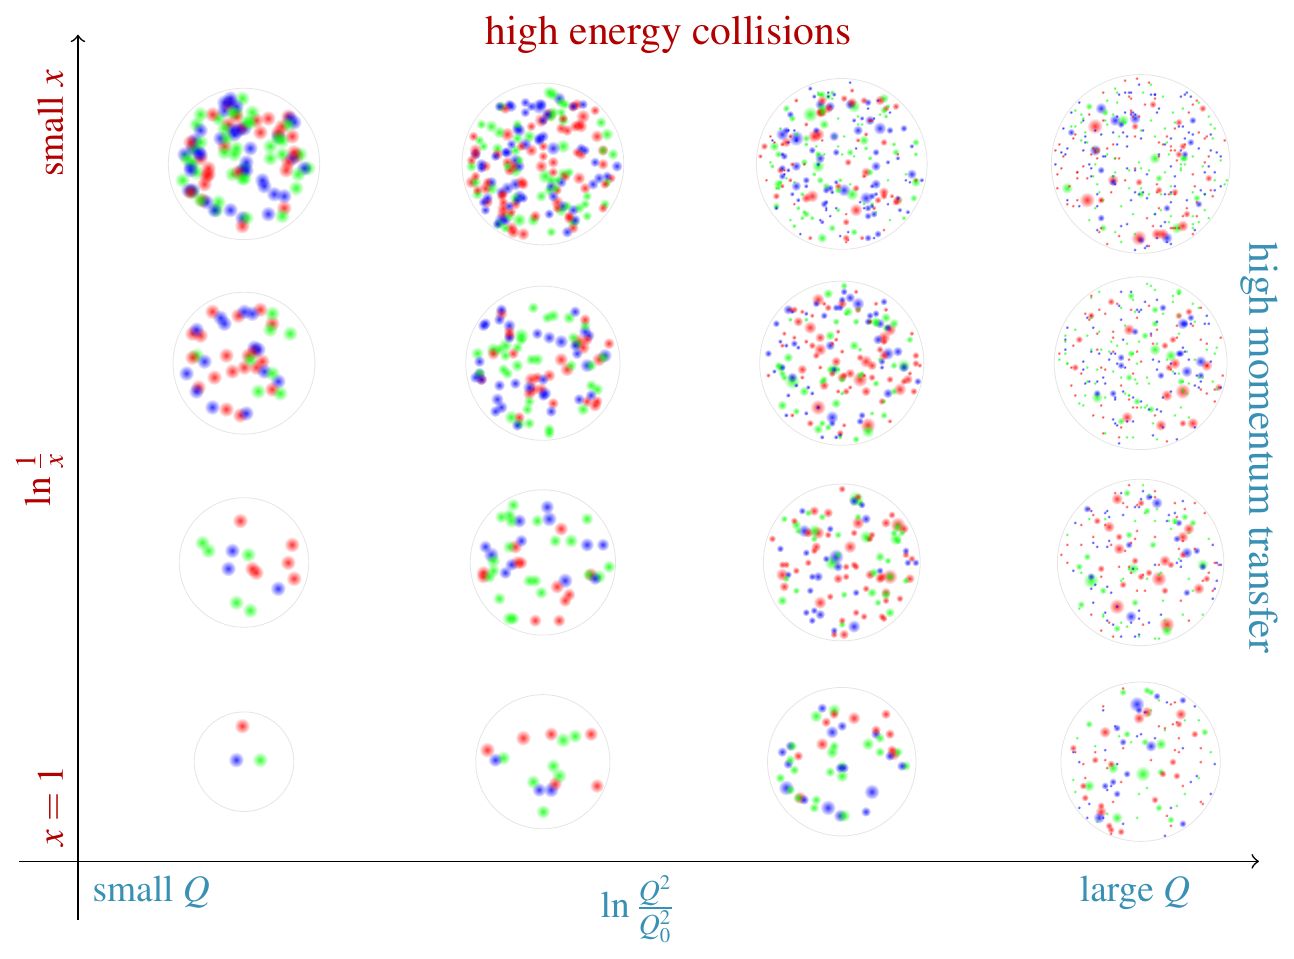
The following diagram shows representative examples of the effective composition of the proton in different kinds of collisions. The vertical axis basically corresponds to collision energy, and the horizontal axis corresponds to the "resolving power" of the incident ("probe") particle. (Resolving power is basically transverse momentum, but I can't explain how that connection works without getting into more detail of quantum mechanics than I think is necessary.) The contents of each circle represents, roughly, a sample "snapshot" of how the proton behaves in a collision at the corresponding energy and resolving power. The exact numbers, locations, and colors of the dots aren't significant (except sort of in the bottom left), just note how they get larger or smaller and more or less numerous as you move around the plot.
So for example, if you hit a proton with a beam of high-energy probes (top) that have weak resolving power (left), it behaves like a dense cluster of partons (quarks and gluons etc.), each of which is fairly large. Or if you hit the proton with a beam of low-energy probes (bottom) with high resolving power (right), it behaves like a sparse cluster of partons, each of which is small. If you hit it with a beam of low-energy (bottom), low-resolving-power (left) probes, it behaves like a collection of three particles.
Physicists describe this apparently-changing composition using parton distribution functions (PDFs), often denoted $f(x, Q^2)$. Under certain not-too-crazy assumptions, $f(x, Q^2)$ can be interpreted as the probability density of the probe interacting with a particular type of parton with a particular amount of momentum. Visually, $f(x, Q^2)$ is related to the number of particles in the circle at the corresponding $(x,Q)$ point on the plot (though again, the exact numbers are not chosen to exactly reflect reality). For more information on parton distributions, I would refer you to this answer of mine and the resources named therein, as well as this one.
What's the gray region?
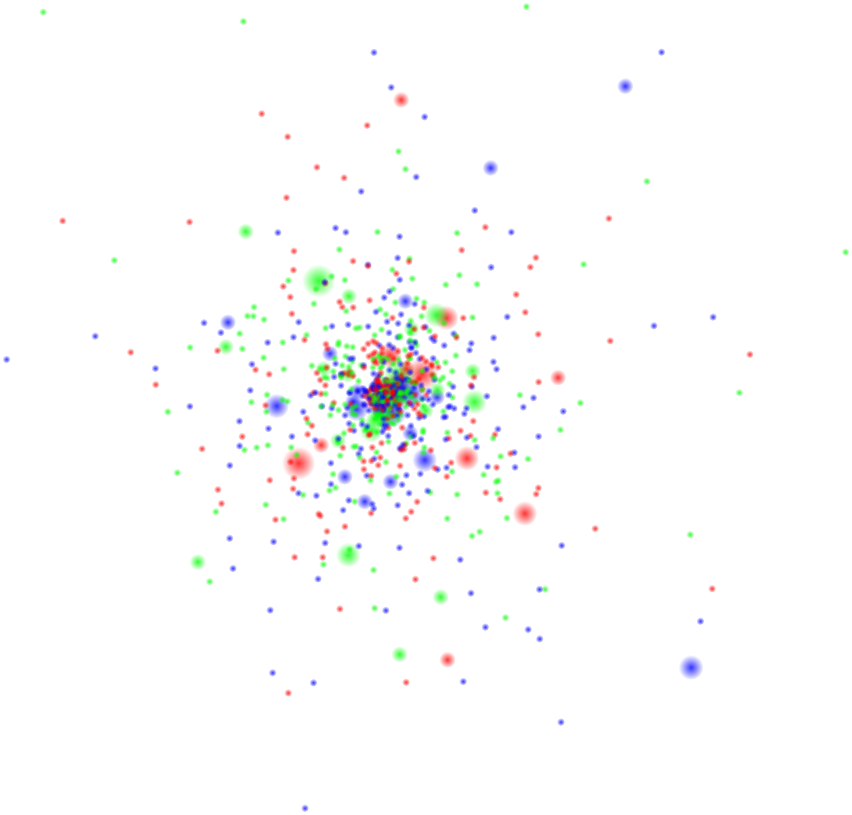
In the preceding image, I displayed each snapshot of the proton as a set of partons (quarks and gluons etc.) uniformly distributed within a circle, as if the proton has a definite edge and there is nothing outside that edge. But in reality, that's not the case. The quantum fields that make up a proton gradually fade away to zero as you move further away from the center, giving the proton a fuzzy edge. So a (somewhat) more accurate sample snapshot would look something like this:
Notice that there are more dots near the center of the proton, and progressively fewer as you move toward the edge; this represents the fact that a probe which hits a proton dead-center is more likely to interact than a probe which hits it near the edge.
The ordinary parton distributions that I mentioned above, $f(x, Q^2)$, are part of a simplified model in which we ignore this fact and pretend that partons are distributed uniformly throughout space. But we can make a more complicated model that does take into account the fact that partons are clumped up toward the center of the proton. In such a model, instead of regular parton distributions, you get more complicated functions, called impact parameter-dependent parton distributions, and denoted $f(x, Q^2, b)$, where $b$ is the radial distance from the center at which the probe hits - the impact parameter.
There have been some theoretical studies showing that these impact parameter-dependent parton distributions trail off gradually as you go to large radii. For example, see figure 5 of this paper (arXiv) or figure 7 in this one (arXiv):

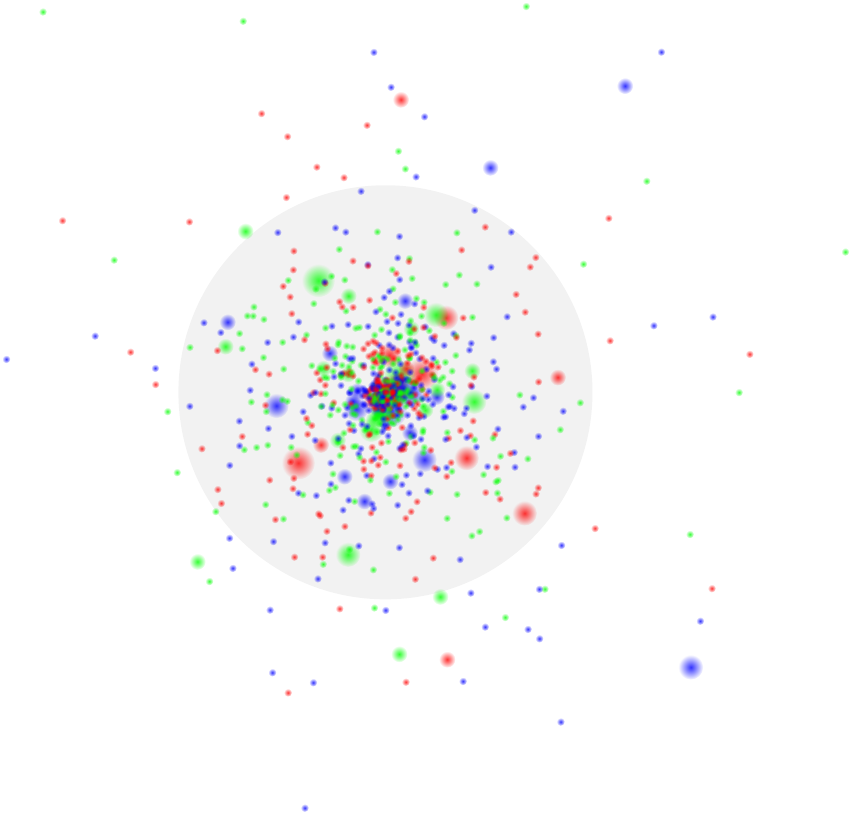
Here $N(y)$ is a quantity related to the parton distributions (specifically, it's the color dipole scattering amplitude), which kind of "condenses" the many different parton distributions into one quantity. (Huge oversimplification, but it's good enough for this.) You can then define the spatial extent of the proton as the region in which $N(y)$ is above, say, 5% of its maximum value. Or 10%. Or 50%. The exact number is somewhat arbitrary, but the point is, whatever number you pick, you'll wind up with a circle that encompasses the region in which the parton distribution function is large, kind of like this:
This is roughly what the gray circle in the image from Wikipedia represents. It's a region with a size on the order of $1\text{ fm}$ (that's about $5\text{ GeV}^{-1}$ in natural units), where the chance of an incident particle (a probe) scattering off the proton is relatively significant. Equivalently, it's the region in which the parton distributions are large, and also the region in which the quantum fields that constitute the proton are much different from zero.
As you can guess, all this is pretty imprecise. You can make a more rigorous definition of the size of a proton by using the scattering cross section. You can also get a definition without using scattering, using the charge radius, which can be measured or calculated using various other methods. I won't go into those, as the details would be material for a whole separate question, but the results of all these methods come out to a radius a little less than $1\text{ fm}$.
Incidentally, this claim of a proton being 99% empty space is probably false using any reasonable definition. You might be thinking of atoms, where the volume in which the electron's quantum field has an appreciable value is much larger than the size of the electron itself, whatever it may be. People sometimes simplify that to say that the atom consists of a large fraction of empty space. But you can't really do the same with a proton, given the large number of particles in it and the strength of their interactions.


