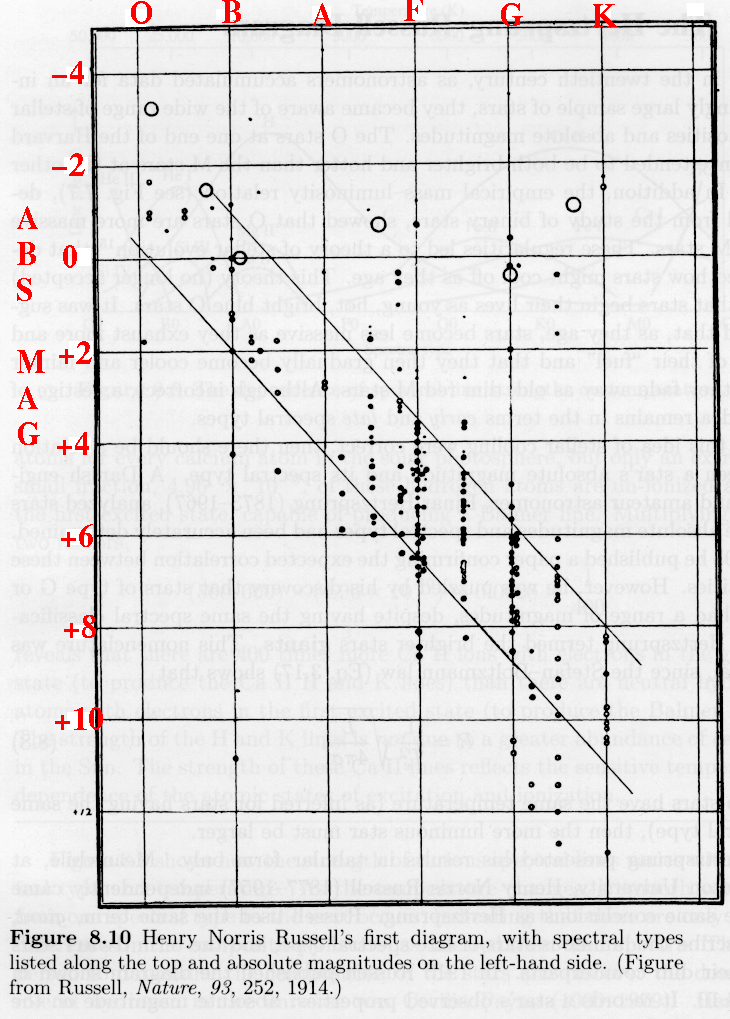
The original H-R diagrams developed by Hertzsprung and Russell did not use temperature along the x-axis at all; they used spectral type. At that time it was not clearly understood what the changing spectral type meant in terms of physical stellar parameters. In this case, the ordering of stars, for instance in terms of the increasing prominence of absorption lines due to metals is caused by *decreasing* temperature. Thus it turned out that the original plots had temperature decreasing to the right and subsequent plots were always made in that same way. 