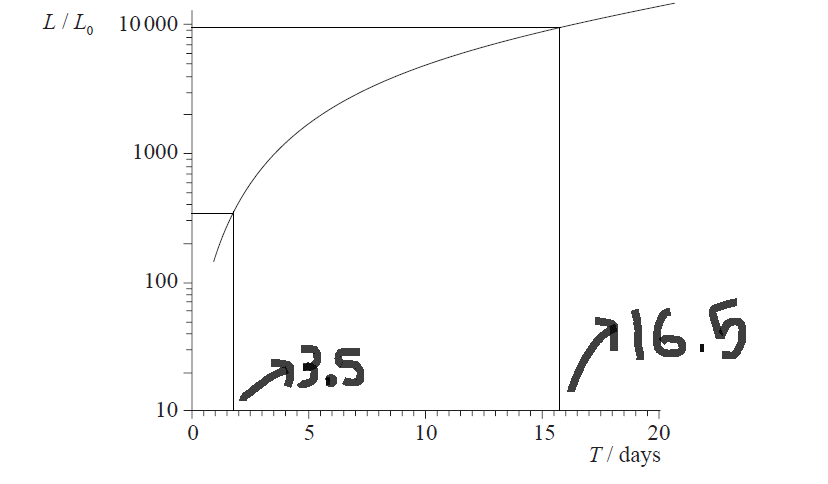
Just to give some background, the graph in the picture below shows the variation of Luminosity with the time period of Cepheid Variable Stars. In the expression $L/L_0$, $L_0$ is the Luminosity of the Sun. The time period of two stars is $3.5$ and $16.5$ days and through the graph one can obtain the Luminosities of these two stars for further computations. The Y-axis has a non-linear scale and I am having difficulty in reading it. Is it logarithmic?
How to read the following graph?
Student
- 1.1k
- 7
- 20
- 48

