Measuring the star formation history of the Universe is a key component in understandng the evolution of galaxies. It is closely related to the other uestion, recently asked by the same person: Are stars getting more metal-rich, less massive and shorter-lived with cosmic time? Although this question pertains to the Universe as a whole, an understanding requires an appreciation of the factors discussed in my answer to that question.
There are several ways this can be attempted observationally, with a number of diagnostics used to make the link between the light we see from galaxies at a range of redshifts and "look-back" times and the rate at which mass is being assembled into stars. None of these diagnostics are perfect, all have their individual problems. The most recent comprehensive reviews of the topic are by Kennicutt & Evans (2012) and Madau & Dickinson (2014) who have been in this field from its inception.
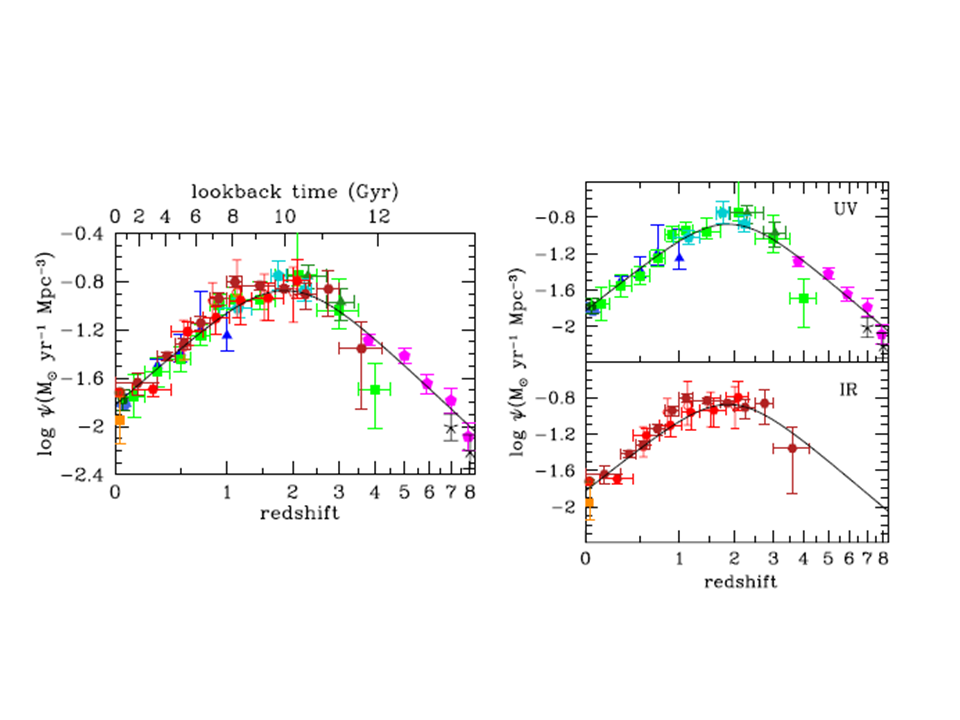
According to their reviews of all the evidence, star formation peaked approximately 3.5 billion years (at a redshift of about 2) after the big bang and has declined roughly exponentialy since then, with an e-folding timescale of about 4 billion years.
The main observational tools are measurements of the rest-frame UV luminosity of galaxies that tell you something about how many massive stars are present; the rest-frame near infrared light is dominated by lower mass stars, so this measures their numbers; rest frame far infrared radiation tells us how much dust there is in distant galaxies and thus by how much the other indicators are extincted and how much material is available to form new stars. These diagnostics are put together with models for galaxy evolution and ideas about the mass spectrum of the forming star to work out conversion from light to mass and a co-moving star formation rate as a function of look-back time.
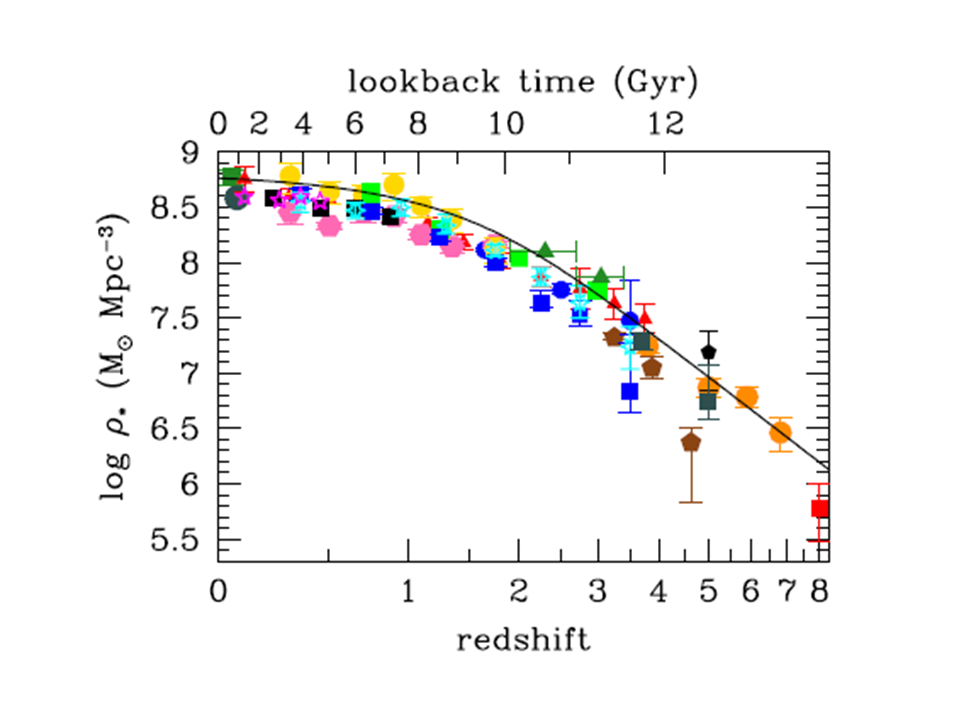
Here are I think the to key plots from Madau & Dickinson's review. The first shows the star formation rate in solar masses per year per megaparsec cubed using various diagnostics (the unlabelled left panel is a comparison of the two on the right). These are co-moving densities; i.e. they take out the expansion of the universe to compare star formation at different epochs. The second plot shows how the (co-moving) density of stellar mass has built up over time. This shows a monotonic increase because most of the stars that are born, and most of the stellar mass, is contained within stars that are long lived ($>10$ billion year lifetimes) and so most of the stars that have ever been born are still alive. The plot flattens off towards the present day because the star formation rate is declining and the Universe is almost old enough so stellar deaths are as numerous as stellar births.


I realise this is only half the answer you are looking for, I may have some time to add to this later, but I can say now that it has little to do (directly) with the average density of the Universe, because stars are born within galaxies and the gravitational potentials and gas densities within galaxies are unaffected by cosmic expansion. e.g. see Why does space expansion not expand matter?
