Q1. You are right.
Q2. The sampling interval in both directions is $6{\rm \mu\,m}$. This yields the peak frequency of the Fourier transform in each case: namely $2\pi/(6\times 10^6)\,{\rm rad\,m^{-1}}$. Note that the Nyquist frequency is half this: the signal is uniquely determined by the samples as long as it is bandlimited to below the Nyquist frequency: the frequency "folds" around the Nyquist frequency so that the FT points above the Nyquist frequency are actually the superposition weights for negative frequency Fourier components. For real valued signals like yours, these negative frequency weights are complex conjugates of the corresponding positive frequency ones, so that they are redundant information. The resolution of the Fourier transform gives frequency spacing. You will almost certainly be doing a radix 2 fast Fourier transform, so you'll need to pad your image out with noughts to make its resolution $2^{N_x}\times 2^{N_y}$ i.e. the resolution components are whole number powers of two. If you have software that doesn't need you to do this, it will almost certainly be doing this automatically for you. So let's assume you embed the image centrally in either a $512\times 1024$ or $1024\times 1024$ complex dataset. In the first case, your frequency samples will be spaced at $2\pi/(512\times6\times 10^6)\,{\rm rad\,m^{-1}}$ in the 512 samples direction and $2\pi/(1024\times6\times 10^6)\,{\rm rad\,m^{-1}}$ in the other. In the $1024\times1024$ case, the frequency spacing is $2\pi/(1024\times6\times 10^6)\,{\rm rad\,m^{-1}}$ in both directions.
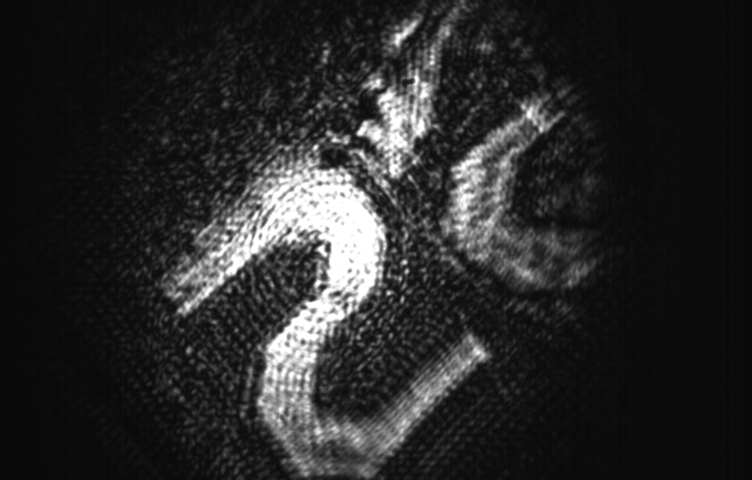
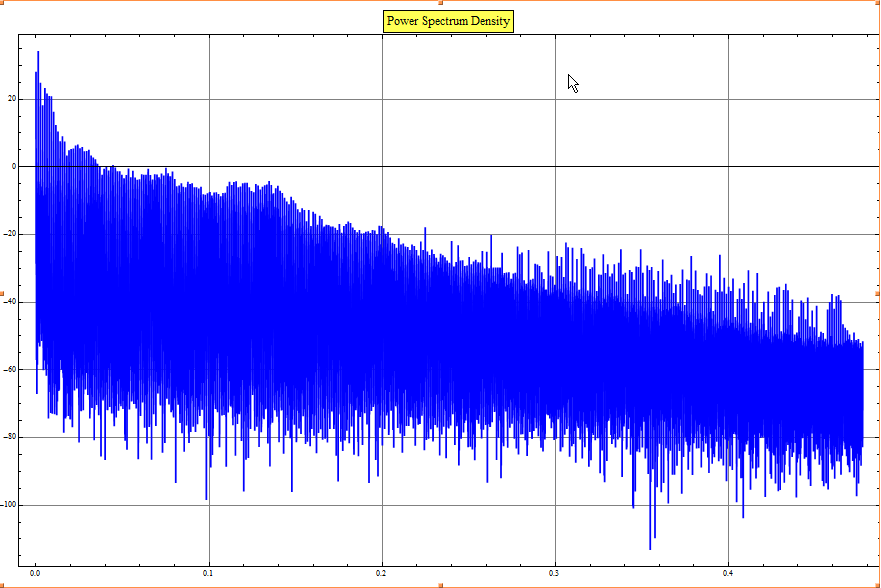
Q3. This question has no definite answer. I would use an "experimental" approach. Set up a signal processing sequence that takes the FFT, set all the components at spatial frequencies higher that a cutoff value to nought and transform back with an inverse FFT. You'll see a smoothed image. Try lowering the cutoff frequency and see how far you can go and still keep the image "understandable", i.e. sharply enough resolved to make out the "meaningful" details. (Ask yourself, "Does the image still mean the same thing for practical purposes". From your frequency spread graphs, it looks as though this bandwidth will be somewhere between about 0.05 and 0.1 on your horizontal axis: this is the bandwidth above which the Fourier weights are between 2 and 3 orders of magnitude smaller than the lowest frequency components.
 PSD:
PSD:

