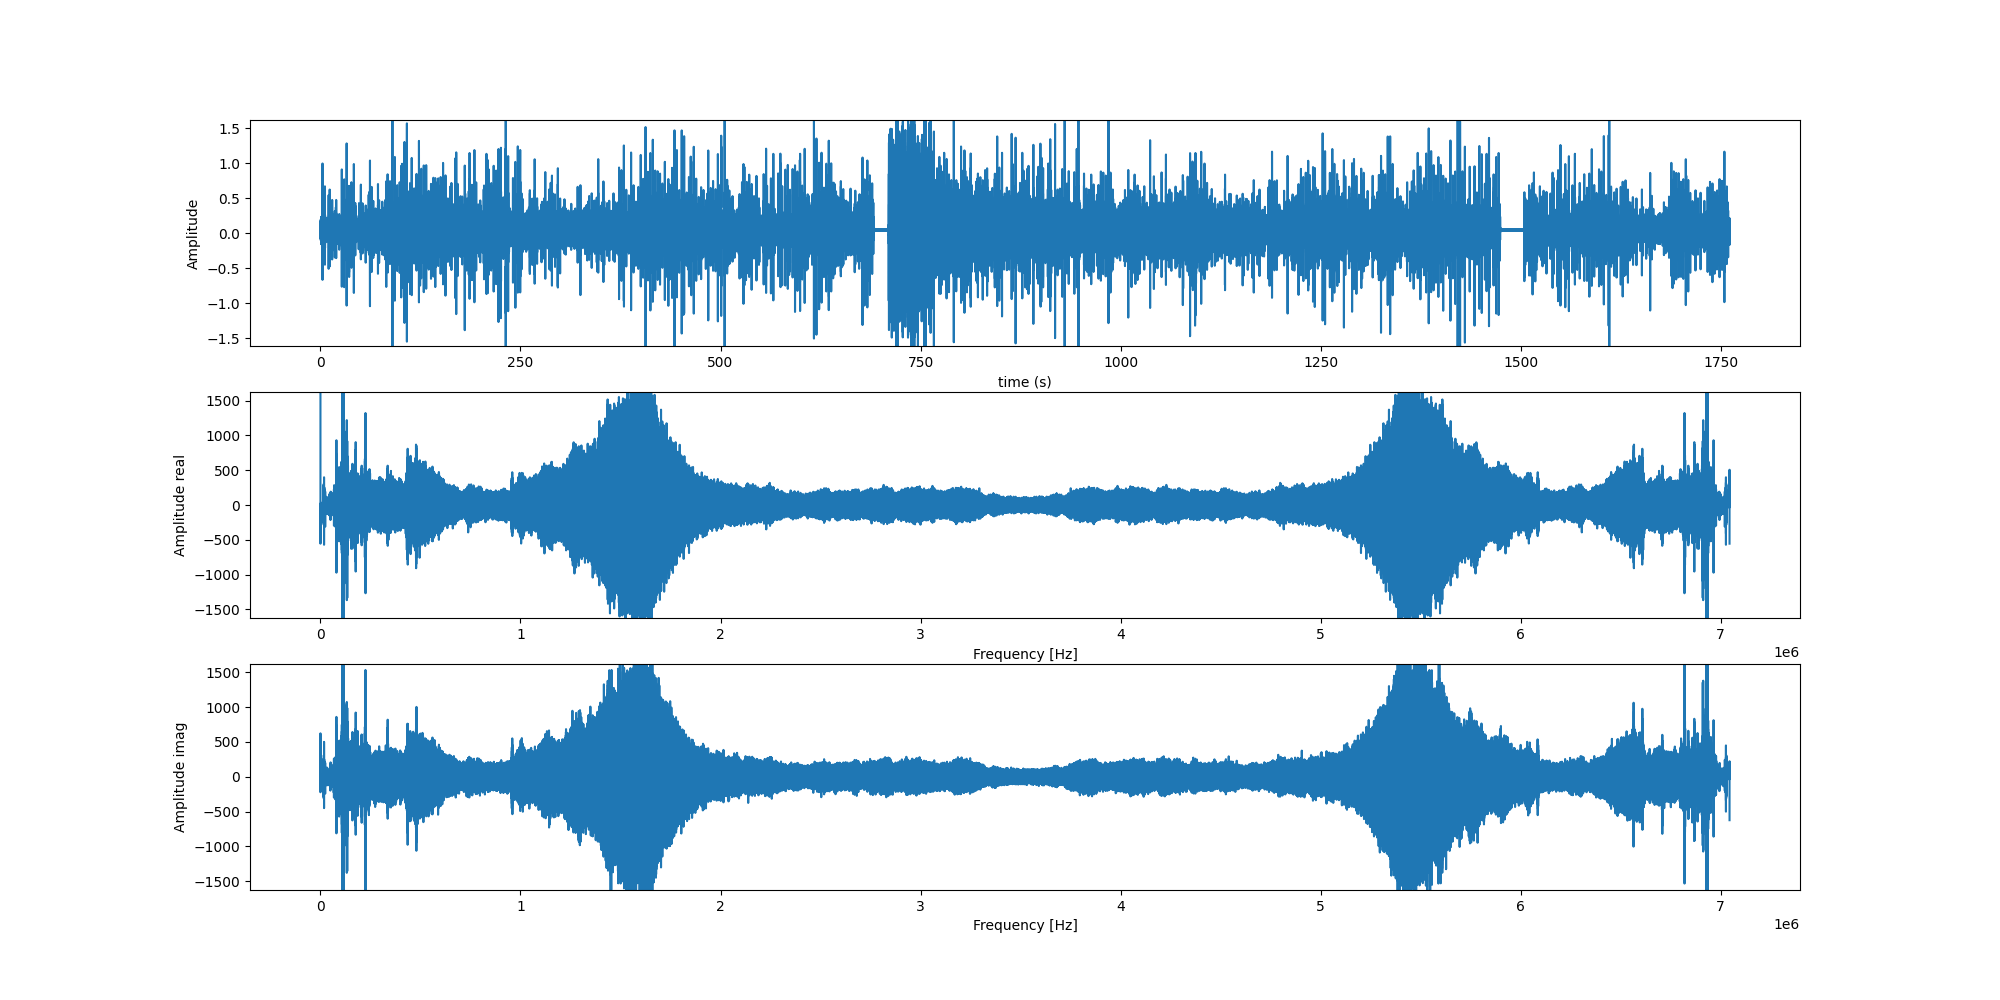
I have two time series from an accelerometer attached to two different factory machines with the hope of picking up subtle differences between the machines and being able to tell when a machine should undergo maintenance before it actually breaks down. My initial idea was to do a Fourier transform of the time series and look at the eigen frequencies of the machines and hopefully be able to pick up something based on that. However, it has been more than a decade since I finished my master in physics and I haven't used the fourier transform in a long time, so I'm quite rusty in this.
The top row is the time series itself, while the bottom 2 rows are the real and imaginary component of the FFT.
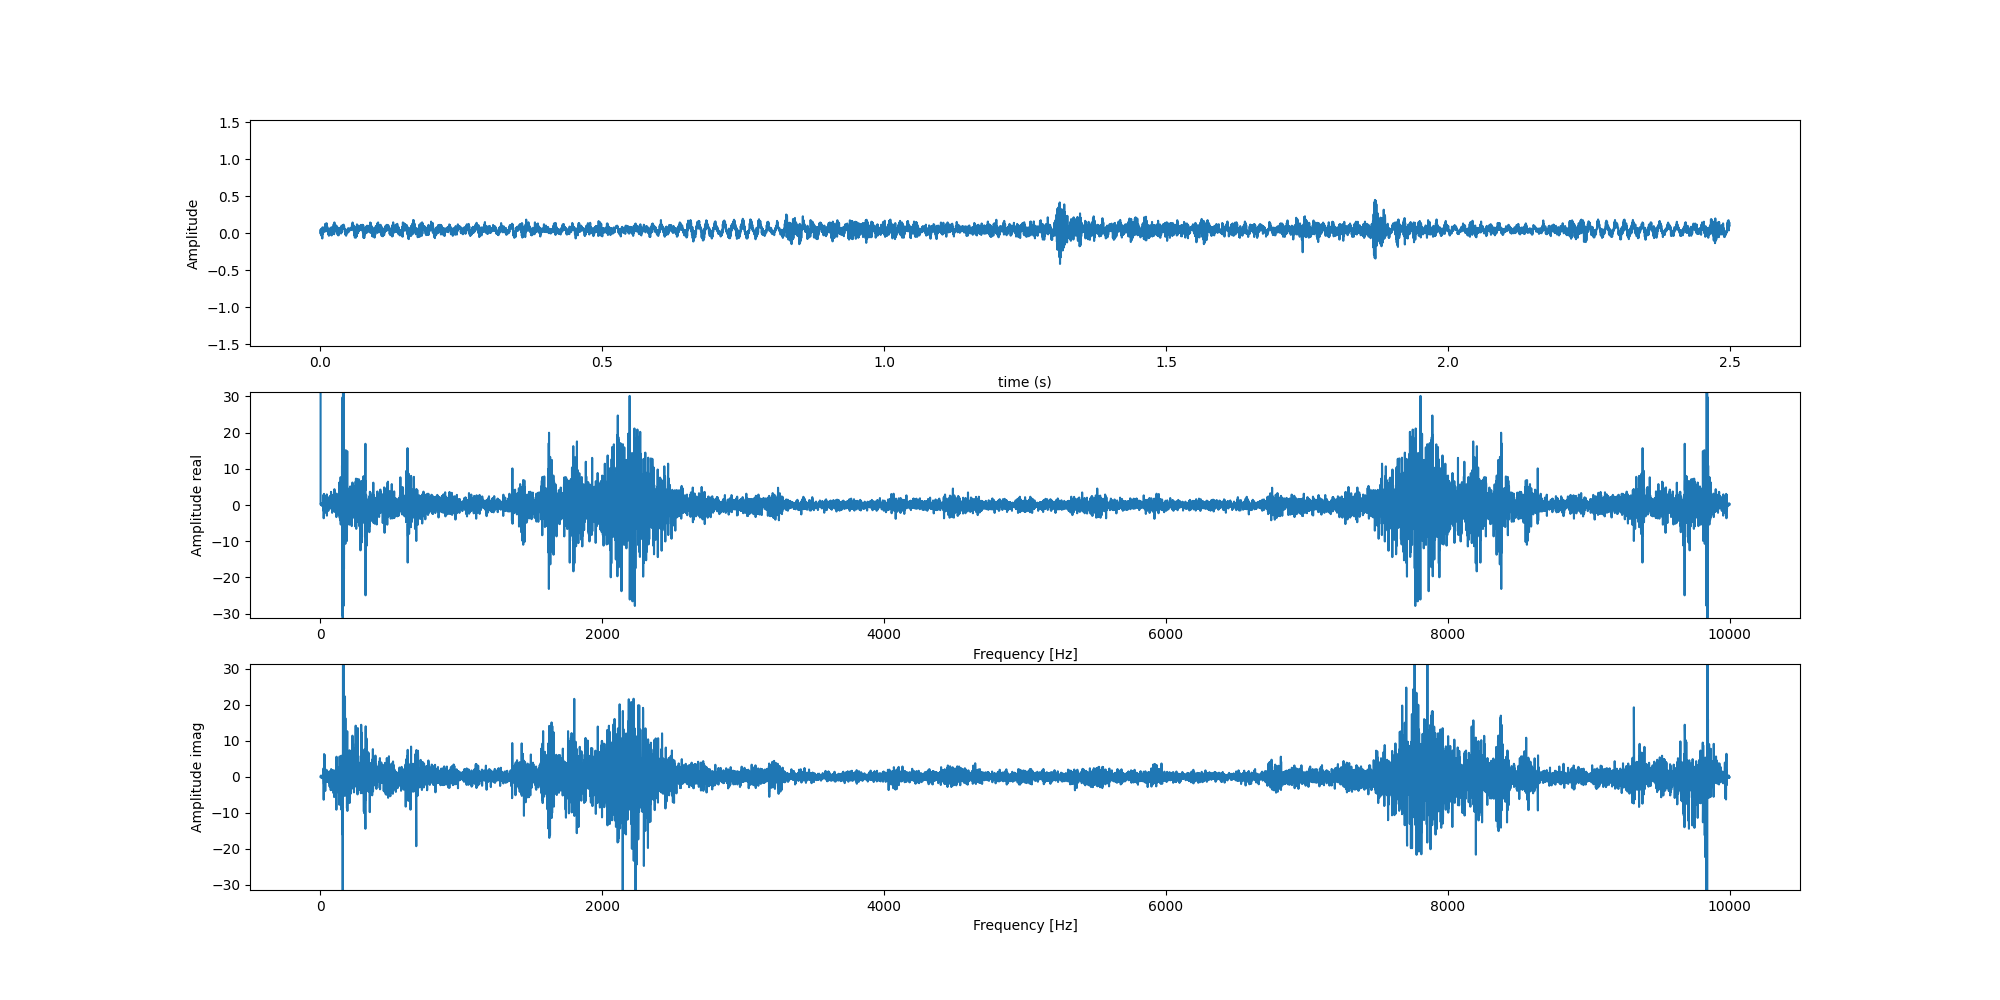
Same as the above, but this time on a small subsection of the data limited to only 10000 samples.
My data is sampled at 1/4000 s and my initial attempt was just to take the fourier transform directly of this time series, as well as some subsets of the time series. However, the Fourier transforms I get from this looks weird to me. Why is the fourier transform essentially symmetric about the halfpoint of the x-axis? This seems un-physical to me and likely means I'm doing something stupid.
Right now I'm just using numpy's FFT algorithm directly on the data, and I don't see anything in the documentation to suggest I should be doing something else.
What am I missing?


