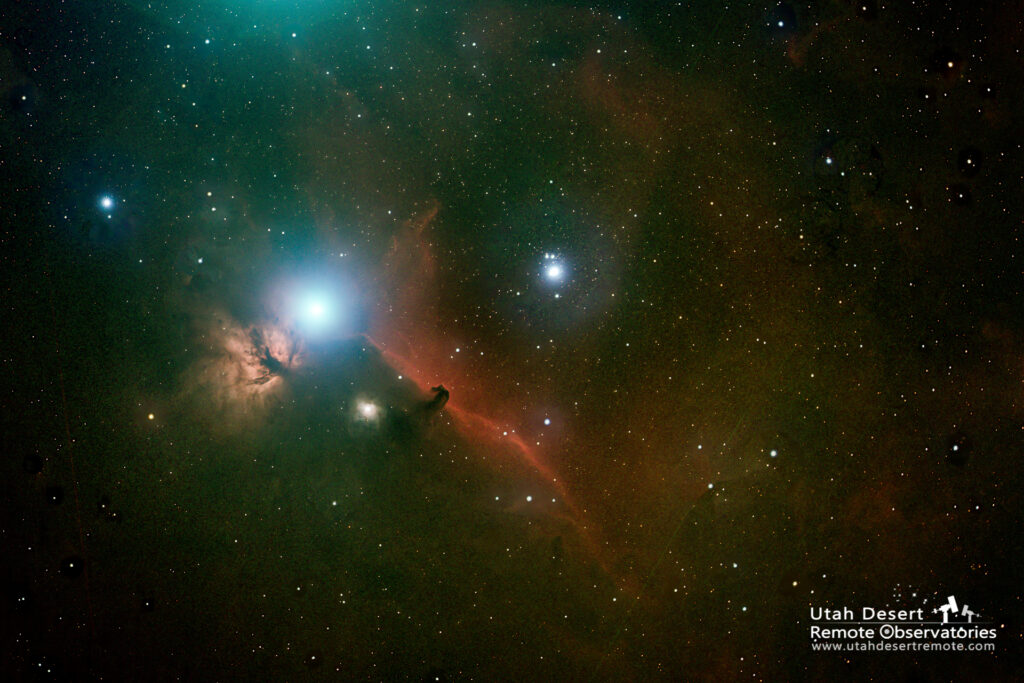
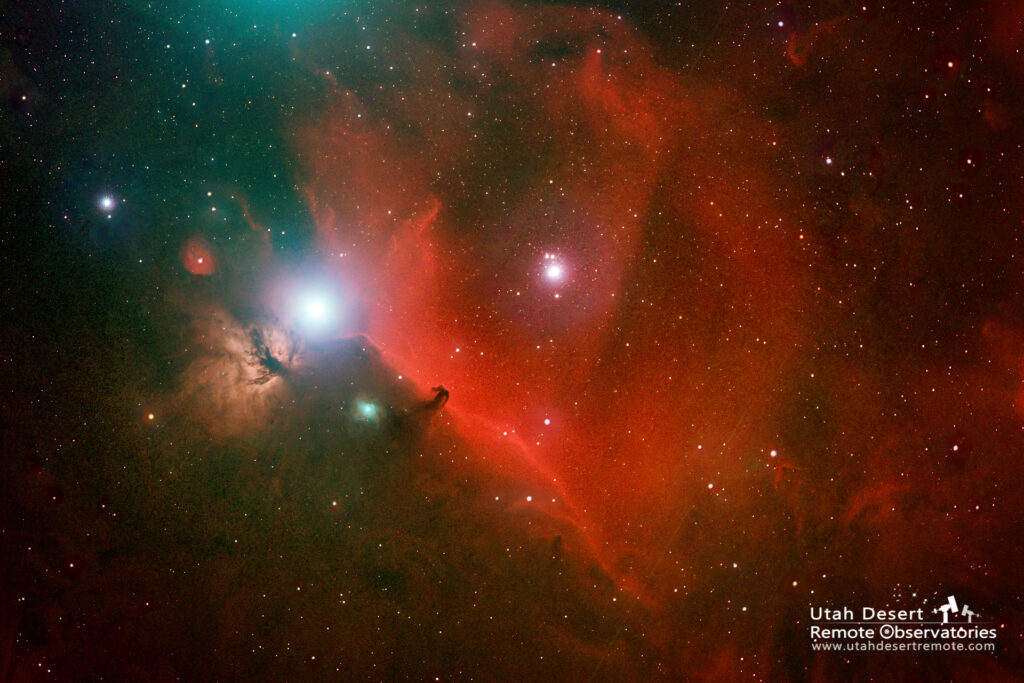
At room temperature, hydrogen gas exists as diatomic molecules that do not significantly absorb light in the visible spectrum, i.e., 400 nm to 700 nm. So hydrogen gas at room temperature is colorless. In a hydrogen gas discharge tube, that is not energized by an appropriate high voltage source, the hydrogen gas is colorless, as shown in my photograph below:

Application of high voltage, via an appropriate high voltage power supply, results in a mixture of excited hydrogen atoms and molecules. Both exist in the discharge and both emit light as they continually cycle around their respective excitation and de-excitation pathways.
This figure shows my photographs of the energized hydrogen discharge tube.
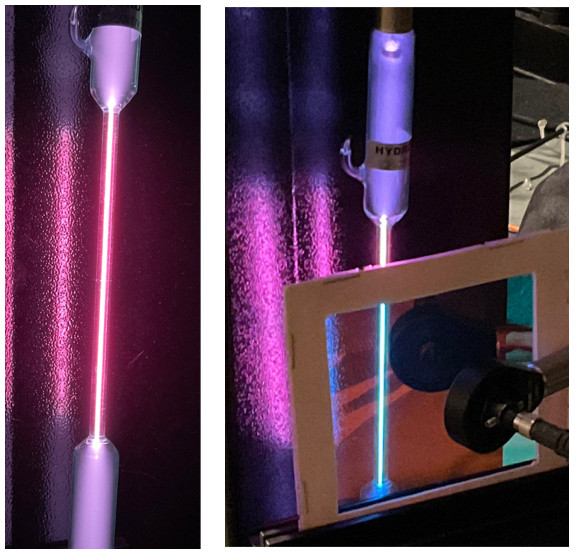
On the left is the raw output. To my eyes, it is quite noticeably red hued. On the right, a filter has been used to attenuate light at wavelengths longer than 600 nm. The light transmitted through the filter is, to my eyes, cyan hued.
Others may see the colors differently, but no matter: we have spectrometers, spectrographs, and the like. So, collecting light from the energized hydrogen discharge tube, and dispersing it using one of my homemade echelle spectrographs results in the following two dimensional spectrum (an echellogram):
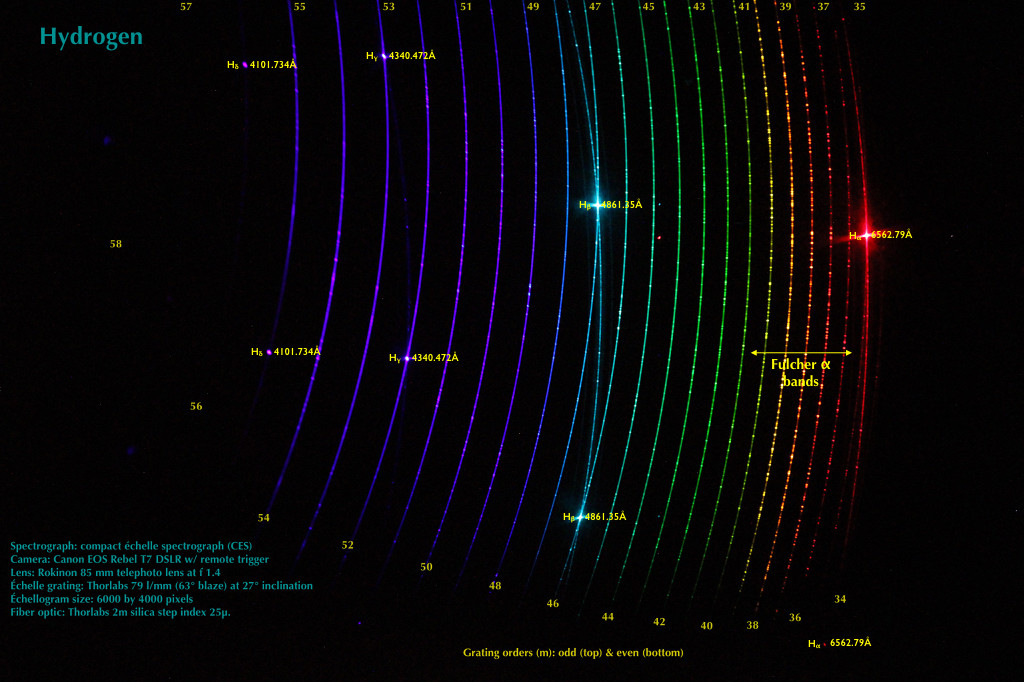
I have annotated the echellogram to show grating orders, the Balmer line wavelengths, in angstroms, and a little about the acquisition of the echellogram. N.B. 1 angstrom = 0.1 nm.
As noted above, the echellogram shows the four Balmer series lines in the visible spectrum. Each is present twice, in consecutive echelle grating orders, as a consequence of how echelle spectrographs may operate. The Balmer lines are from excited hydrogen atoms emitting light as they de-excite. The other light is from other excited species, e.g., excited hydrogen molecules.
Note particularly the Fulcher alpha bands in the longer wavelength region of the echellogram. These have been know for many years and are useful for various purposes, e.g., in plasma diagnostics. A spectrum in conventional format, i.e., intensity versus wavelength, is shown below:
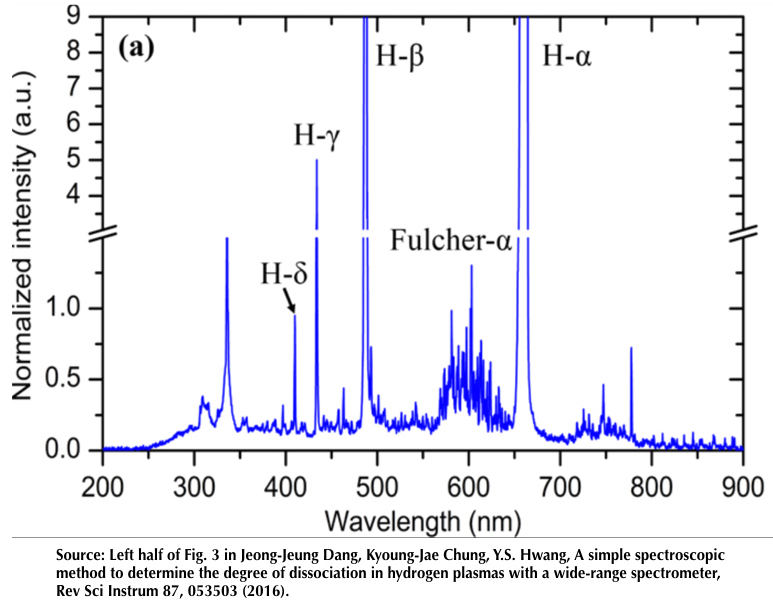
So it is a bit more complex than just those nice Balmer lines. The neat thing about spectroscopy is that the more you look, the more you see.


