0
$\begingroup$

As the title suggests i have attempted comparing the variance of the position of particles of a sample of matter with the sample's temperature.
Now firstly we need to clarify the basics:

  1. method for averaging a continuous function:
    $$ M\{f\}(a,b)=\frac{1}{b-a} \int_{a}^{b} f(x) \, dx $$

  2. method for computing the variance of a continuous function:
    we have $$\tag{*} \sigma^2=\sum_{i=1}^N \frac{(x_i - \bar{x})^2}{N} = (\sum_{i=1}^N \frac{x_i^2}{N}) - \bar{x}^2 $$
    Now notice that $$(\sum_{i=1}^N \frac{x_i^2}{N}) $$
    is the same as the average of the function $f^2(x)$ (assuming $\forall x_i\Rightarrow x_i \in R_f$) so with a bit of substitution and simplification we will have:
    $$\sigma^2\{f\}(a,b)=M\{f^2\}(a,b) - (M\{f\}(a,b))^2$$
    Okay!Now that we have our tools;we can continue to compute the desired variance. Notice the "variance" of the function of position of a moving particle gives us a scalar that indicates that how much the particle -sort of-"wobbles".
    now if we have a sample consisting of 500 water molecules and we have the function of position of each particle with respect to time-and assume they are all moving in a simple harmonic manner (i.e $x(t) = A\cos{\omega t}$)-we can theoretically compute the total energy of the system:
    $$Q = \sum{K} = \frac{1}{2}m_{molecule}\sum_{i=1}^N(\frac{dx_i}{dt})^2 = m_{total}cT = cT\sum m_{molecule}$$ note that the total heat energy of a system can be computed like so:$$Q = mc\Delta T = mc(T_1-T_0)=mc(T_2-0) = mcT_2$$(because the heat energy of a system is zero at zero kelvin) and let's define the "variance" of a system as follows:
    $$\sigma^2[S]_{0}^{t}= \frac{1}{N}\sum_{i=1}^N \sigma^2\{x_i(t)\}(0,t)$$where $x_i(t)$ is the equation of motion of the i-th particle.
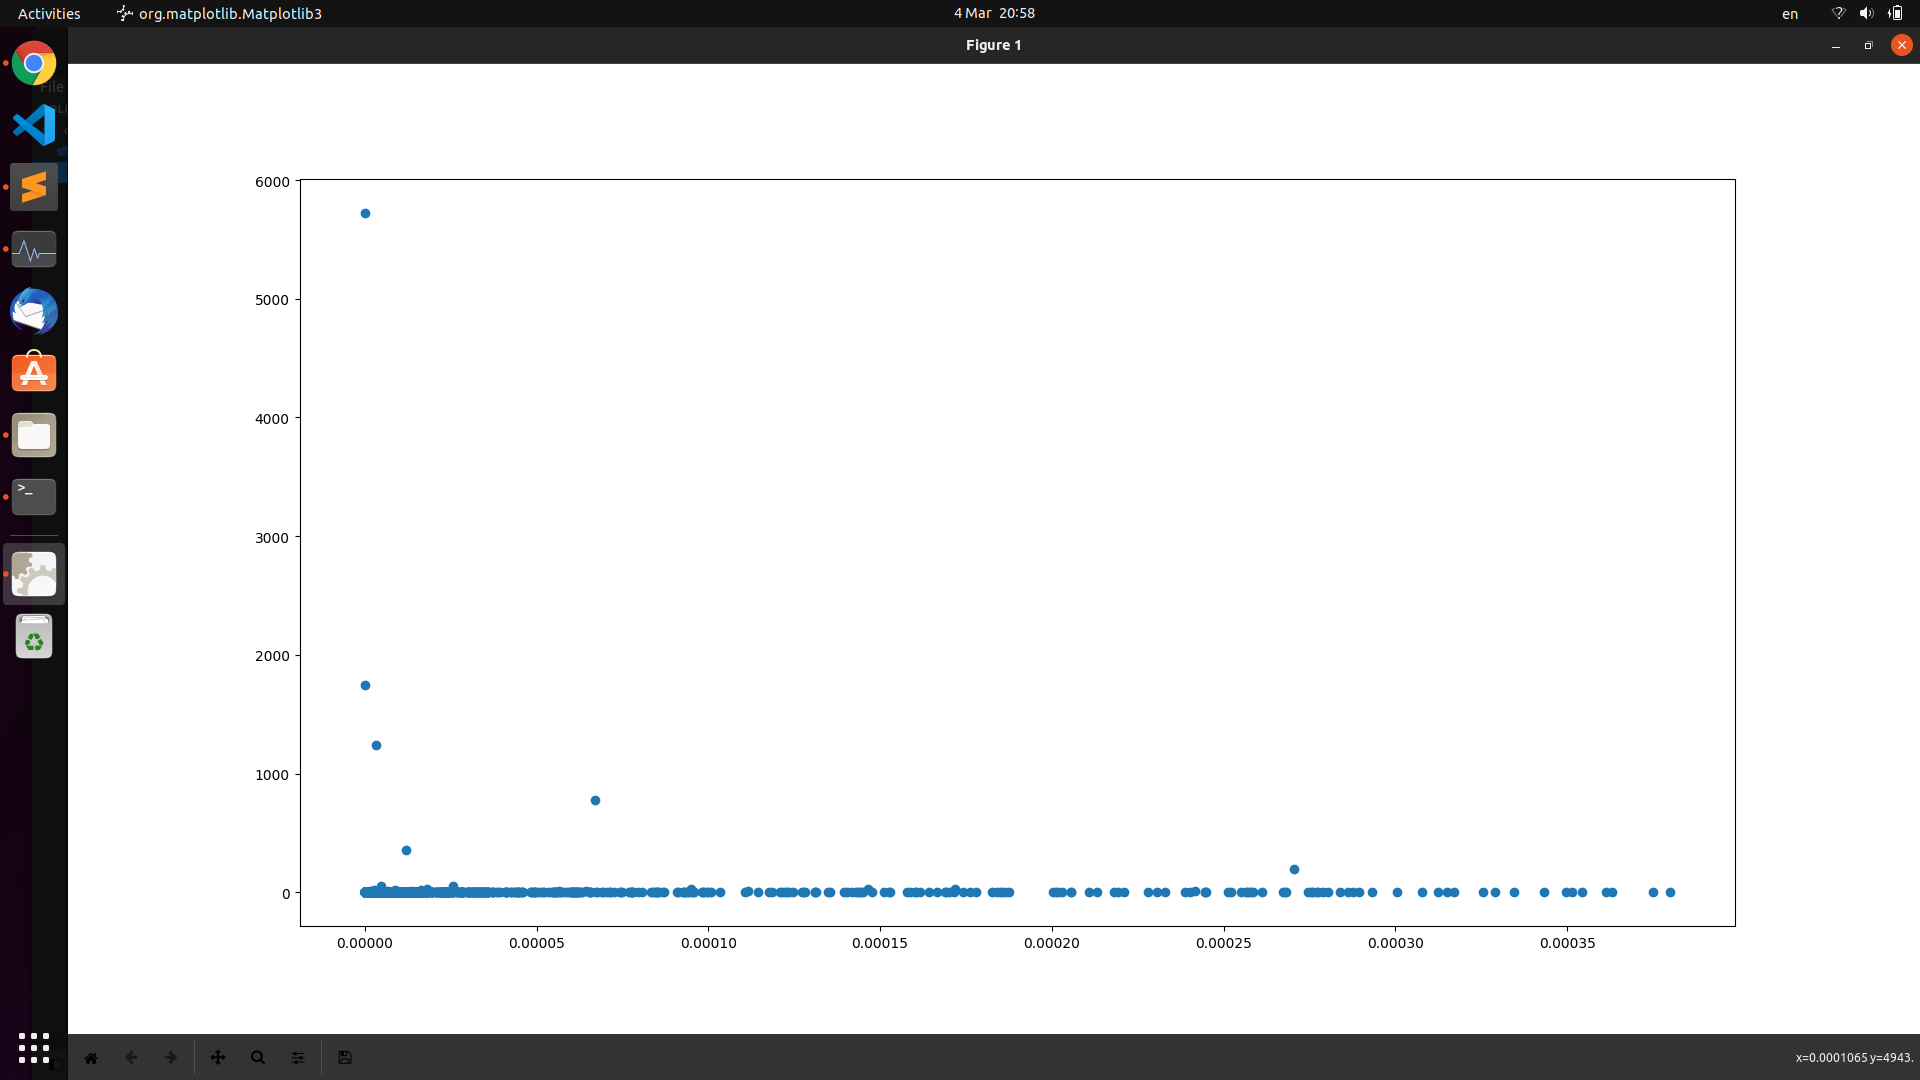
    now if plot the variance of a system against its temperature using a code I wrote you can see it here.

now it takes about ten minutes to completely render and do all of the needed computations - my code is inefficient and my computer slow:( - and the final plot (the $y$ axis is variance of the system and the x axis is the temperature of the system) and the computed image is like follows:

Fig 1


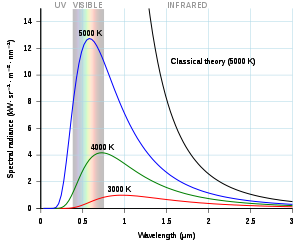
now if we had more continuous data i suspect it would strangely resemble this figure here.(And I have ran it several times and it was not an accident.)

Fig 2


Now my question is if this connection really exists and if so why? Please note that I am currently in high school and please try not to get things too complicated.

$\endgroup$

1 Answer 1

0
$\begingroup$

With $x(t)=A\cos(\omega t)$ we have the variance, if I did the integrals correctly, as \begin{align} \sigma^2\{x\}(0,t)&=\textstyle\frac{1}{t}\int_0^tx^2(s)\,ds-\frac{1}{t^2}\big(\int_0^tx(s)\,ds\big)^2\\ &=\textstyle \frac{A^2}{2\omega} +\frac{A^2\sin(2\omega t)}{4\omega t}-\frac{A^2\sin^2(\omega t)}{\omega^2t^2}\,. \end{align} It looks like you draw the amplitudes $A_i$ randomly from a uniform distribution on $\{0,1,...,10\}$ for an ensemble of $N$ particles. The frequencies you simulate by drawing uniformly a period $T_i$ from $\{1,...,10\}$ and setting $\omega_i=2\pi/T_i$. Then you take the average of the variance $$\tag{1} \frac{1}{N}\sum_{i=1}^N\sigma^2\{x_i\}(0,t)\,. $$ The temperature is proportional to the total kinetic energy and is therefore proportional to the sum $$\tag{2} \sum_{i=1}^N\dot x^2_i(t)=\sum_{i=1}^NA_i^2\omega_i^2\sin^2(\omega_i t)\,. $$ Your $N$ is 1000. A single point in your plot is (2) on the $y$-axis vs. (1) on the $x$-axis. You repeat this simulation with 500 different seeds.

So far so good. This python program can probably be made useful, however:

I find it extremely unlikely that the scatter plot of 500 points with five outliers has anything to do with Planck's radiation law.

  • That law describes the intensity of black body ratiation, not the temperature distribution of water molecules.

  • Even for the study of water molecules, the way you draw the random parameters $A_i$ and $\omega_i$ looks a bit too simplistic.

  • With five outliers, the scatter plot is too insignificant.

$\endgroup$
3
  • $\begingroup$ well i considered that and made more samples -and waited more:)-but as expected the number of outliers increased to ten. which in itself is still pretty much insignificant but my question is why don't these outliers take place in higher temperatures and only occur when the temperature between 0 and 0.00005 kelvin?(they occur in higher temperatures but less so maybe on or two and the result is not that high) $\endgroup$ Commented Mar 5, 2022 at 6:20
  • $\begingroup$ I think you should study the Maxwell-Boltzmann distribution. If you want your model to describe that you can drill down in python every outlier and look at its trajectory in detail. Python is a terrific tool to learn. Use it to have fun with physics. $\endgroup$
    – Kurt G.
    Commented Mar 5, 2022 at 8:59
  • $\begingroup$ Thanks for the advice! And by the way I am making some optimizations and adding some features to the code! $\endgroup$ Commented Mar 5, 2022 at 18:27

Your Answer

By clicking “Post Your Answer”, you agree to our terms of service and acknowledge you have read our privacy policy.

Not the answer you're looking for? Browse other questions tagged or ask your own question.