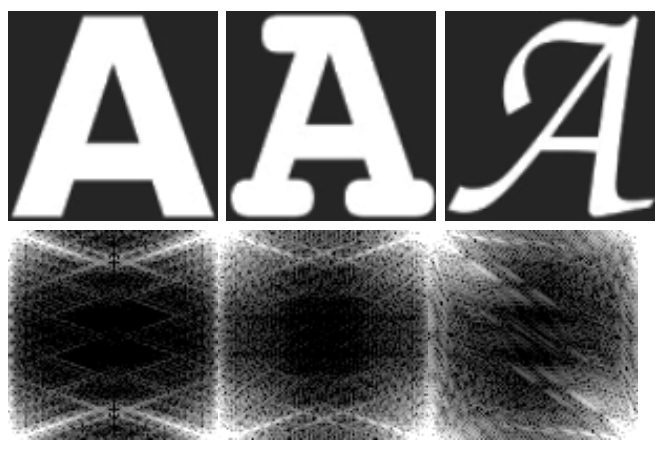
I have some questions about this interesting concept I came across about 2D Fourier transform, please...
Firstly, the Fourier transform of a 1D signal (such as a sound recording) is as follows:
The first picture is a graph of the real sound file, and the second picture is the sorted frequency bins of the analysed original recording. Although the the graphs are often plotted next to each other, the frequency domain graph really is not at all related to space dimensions, as it has no relations at all to the physical shape of the sound waves (or images file) etc. It is just a histogram of the strength of the different frequencies found after analysis, from bin 1, 2, 3... into a chart.
But, when we come to the 2D Fourier transform for images, suddenly I have trouble even picturing what this might possibly mean?
What is meant by the Fourier transform of a 2D signal? Do we take many 1D Fourier charts in the x-direction as before and do another meta Fourier transform in the y-direction on these frequency charts?
Since frequency charts are not even about spatial relationships, but really about histograms of tabulated frequencies, what does the frequency picture even represent? How to calculate the color value for each of the point $(x,y)$ in the frequency image, and what does the $x$-axis represent, what does the $y$-axis represent in this frequency image?
EDIT: Forward Fourier transform results


