0
$\begingroup$

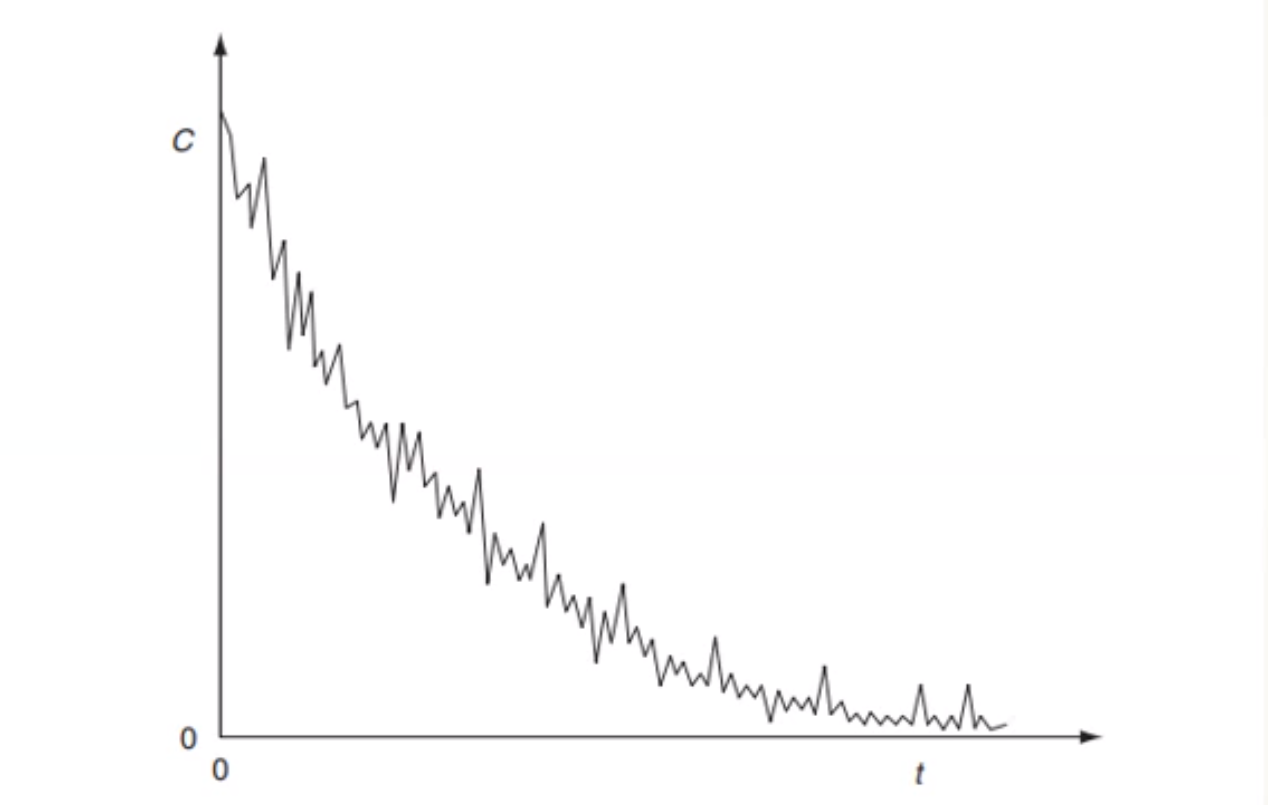
enter image description hereMy book wrote that looking at such graphs, we can say that it is a decay process.

We know that the radioactive decay for any particular nucleus is a random process, now, if for any nucleus, the count rate can be random, then there's the possibility that the successive daughter nuclei undergo more decays at that particular time. Even in this case, it is still a decay process, only the daughter nucleus formed is more radioactive at that moment, but the graph shows an increasing trend in this case that I am considering. Is there anything that I am missing because I am really confused here?

$\endgroup$
1
  • $\begingroup$ What do you mean with such graphs? Can you include a picture? $\endgroup$ Commented Jul 10, 2021 at 14:28

2 Answers 2

3
$\begingroup$

The time at which a particular nuclei decays is random, but the decay rate for a population of identical nuclei is not random. For a given isotope the decay rate is the same for all nuclei of that isotope.

Simple textbook examples usually assume that the products of radioactive decay are not themselves radioactive - this means the activity curve of a sample is a nice smooth exponential decay curve. In real life daughter nuclei may be radioactive, with their own half-lives, and this complicates the activity curve since it is now a combination of the activity of the parent nuclei and their daughter nuclei.

$\endgroup$
1
$\begingroup$

If I understand your question correctly, I think you agree that the picture shows a decay process, but not all decay process have to look like this? If so, you are correct. This picture shows the decay of a single radioactive isotope.

If you have multiple radioactive nuclides, and one nuclide decays into a second one, the overall radioactivity can increase with time. I am not sure what book you are using, but I would consider this an advanced topic. You first have to understand the decay of a single nuclide and I think the picture in the book is appropriate. If you read further in other textbooks, it will probably show graphs with multiple nuclides decaying in a chain.

$\endgroup$

Your Answer

By clicking “Post Your Answer”, you agree to our terms of service and acknowledge you have read our privacy policy.

Not the answer you're looking for? Browse other questions tagged or ask your own question.