1
$\begingroup$

I am using SimNRA to simulate the classical Rutherford Scattering. Playing around with it, I came across some spectra that I cannot explain...

First of all, if someone plots the spectrum of scattering angle $\theta=0$ will get one! I expected that I won't get any spectrum at all. Are there any higher order terms apart from $1/\sin^4\theta$?

Secondly I get three different kind of spectra. For angles $0<\theta<60$ I get a perfectly gaussian distribution
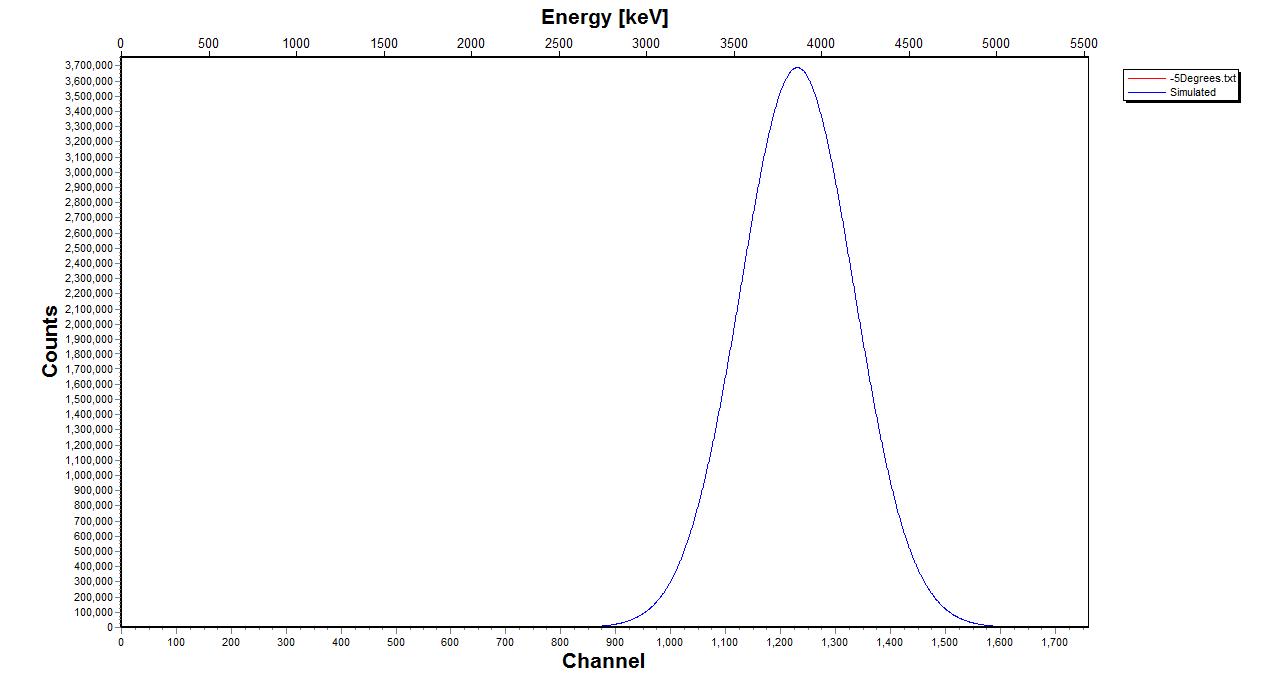
enter image description here

If I am around $90^\circ (80<\theta<120)$ I get a rhather confussing spectrum which looks like that
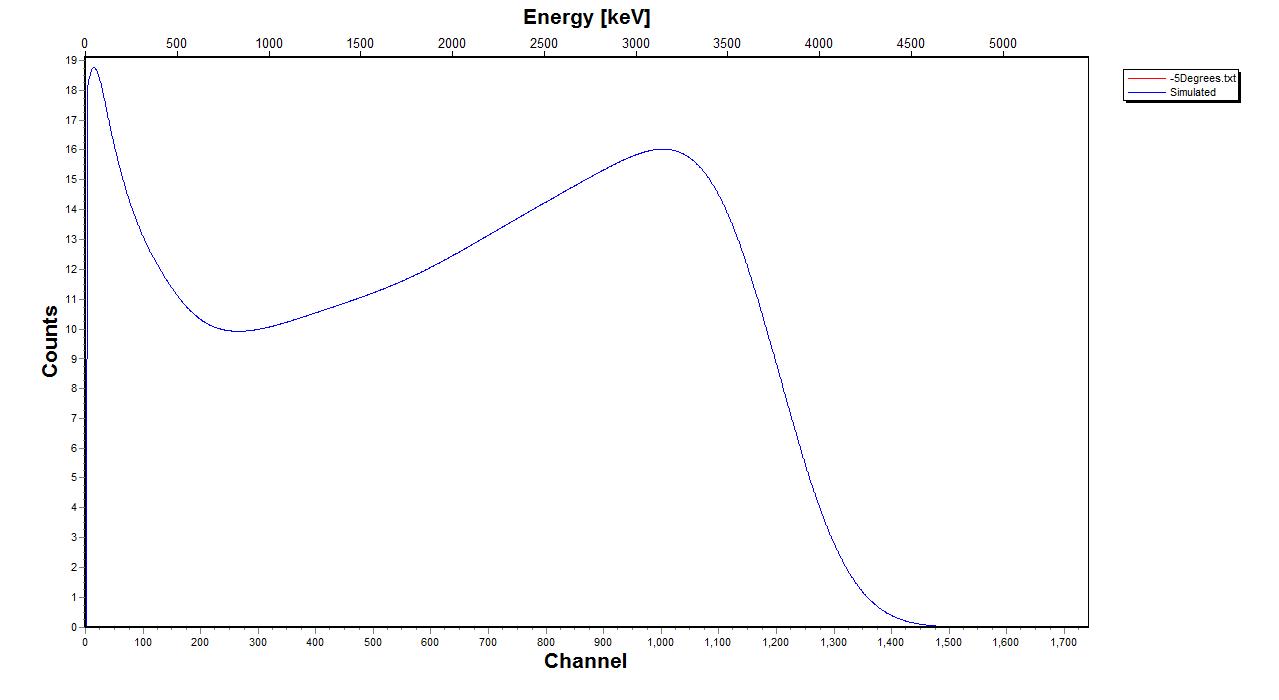
enter image description here

For scattering angles $120<\theta<180$ I get a weird spectrum as well
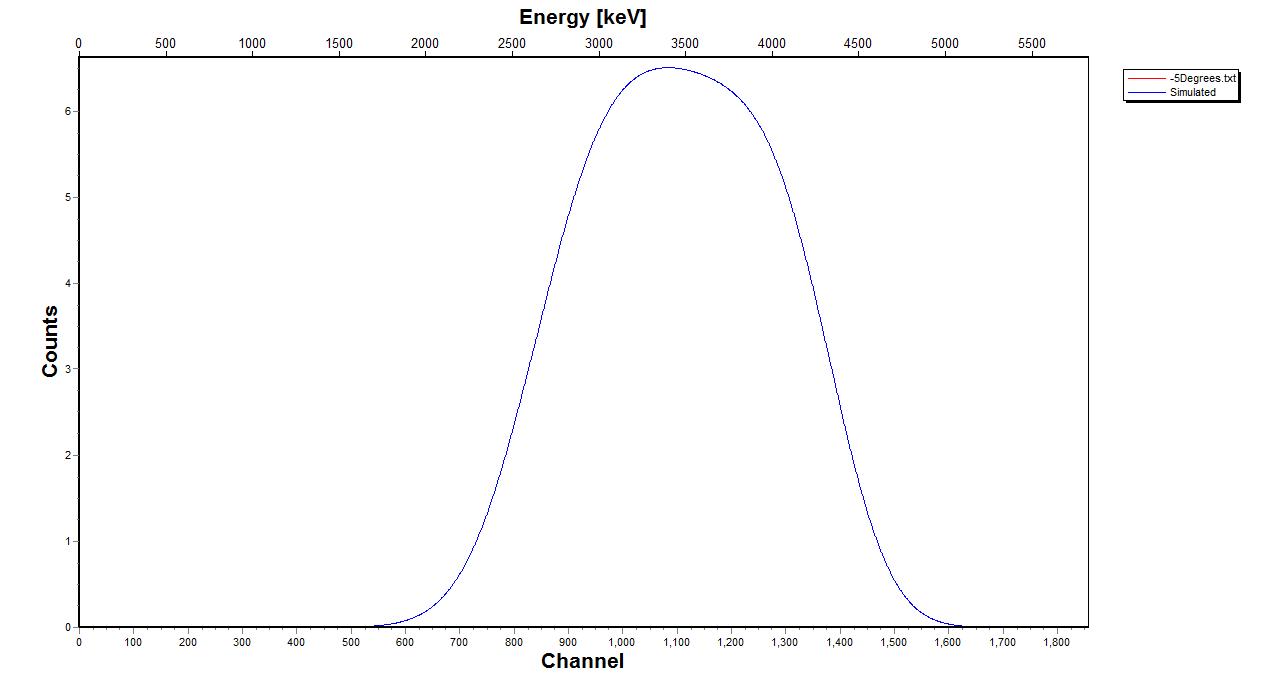
enter image description here

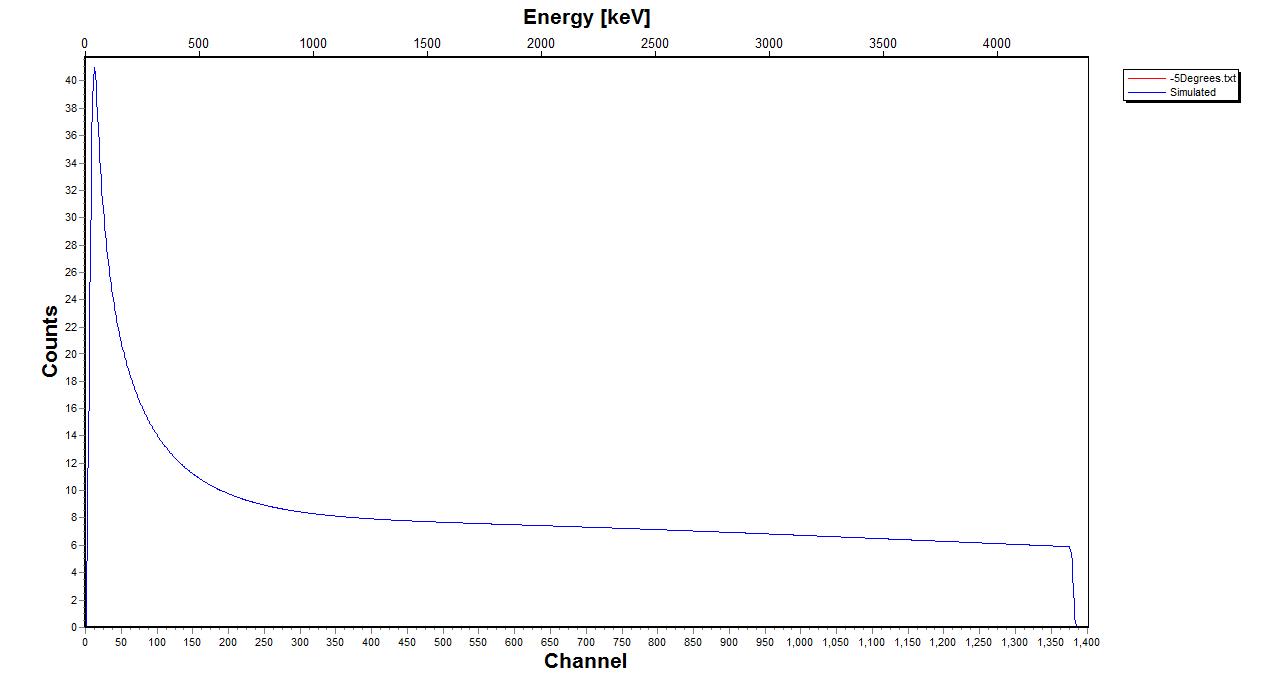
Why am I getting so different a spectrum for those scattering angles ranges? I've read that the last one is used in RBS to define the thickness of a leyer but why does it have that specific behaviour?

And what is this small peak around $90^\circ$? Could that be a recoil gold atom? If so, I cannot understand how a light $4.7\;MeV$ particle can move away a heavy atom...

Any help or hint will be more than welcome!!!

EDIT All the above are for a target of $2\mu m$ thickness and a beam with $500keV$ spread. If I turn off the energy spread the backscattering specrtum has the same flat distribution.
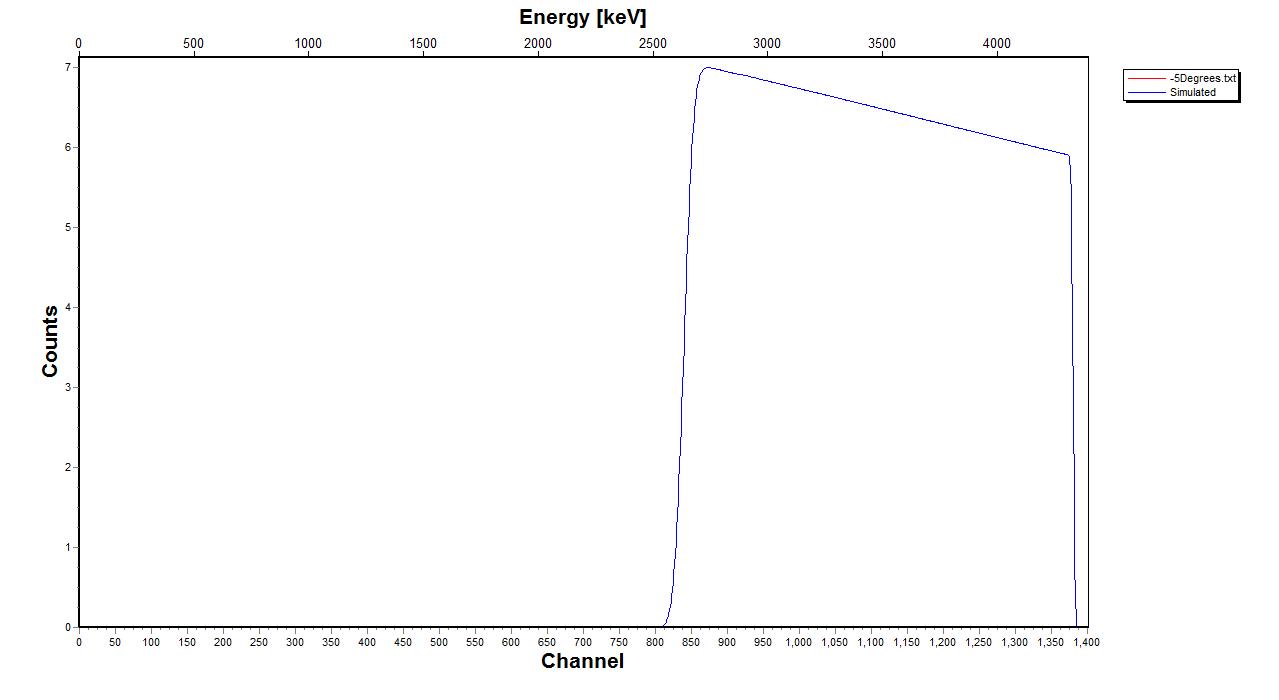
In addition if the target is $5\mu m$, with no energy spread the spectrum is
$\endgroup$
10
  • $\begingroup$ Looking at the vertical axis of the last plot it becomes instantly clear that this piece of software is not plotting histograms of counts (which is the way you should be looking at this kind of data, simulated or not). The smooth curves you're seeing are lying to you. $\endgroup$ Commented May 3, 2013 at 16:32
  • $\begingroup$ @dmckee: Thank you very much for your comment! Indeed, it's not plotting histos, but why is it lying to me? The shape is-let's say- something that I've been expecting. I've seen similar from RBS spectra. What I am trying to get is why there is such a flat distribution in the last plot and what is the peak in low energies in the second plot. $\endgroup$
    – Thanos
    Commented May 3, 2013 at 16:45
  • $\begingroup$ Is it simulating energy loss as well as Rutherford scattering? $\endgroup$
    – user4552
    Commented May 3, 2013 at 16:52
  • $\begingroup$ @BenCrowell: Thank you very muach for your comment. It's simulating the spectrum that should occur for different scattering angles. In general SimNRA can "simulate" scattering! $\endgroup$
    – Thanos
    Commented May 3, 2013 at 17:10
  • 1
    $\begingroup$ A vacuum chamber doesn't help when the target is of finite thickness. Worse, for alphas very, very low areal densities are still significant so even thin foils are significant. Ben's questions is important; it goes to the question of how sharp the energy distribution of the alphas was at the time of the interaction and how much energy they may have lost in leaving the target as well. $\endgroup$ Commented May 3, 2013 at 18:27

1 Answer 1

1
$\begingroup$

From the linked website (emphasis added):

SIMNRA is mainly intended for the simulation of non-Rutherford backscattering, nuclear reactions and elastic recoil detection analysis (ERDA). More than 300 different non-Rutherford and nuclear reactions cross-sections for incident protons, deuterons, 3He, 4He and Li-ions are included.

You've no reason to think that the results are going to be correct for Rutherford processes. Indeed, the authors seem to believe that they will be incorrect.

$\endgroup$
4
  • $\begingroup$ Thank yoy very much for your answer! Look, this isn't about SimNRA! This is about the spectra! For instance this is a spectrum from RBS ams.ethz.ch/research/material/iba/rbs-example.gif?hires Why does it have this flat dustribution. Or what's that peak in low energies, when scattering angle is about 90 degrees. If this peak is due to miscalculation it suits me! But this flat distribution, is for real, isn't that right? $\endgroup$
    – Thanos
    Commented May 3, 2013 at 17:52
  • $\begingroup$ SimNRA most certainly includes "Rutherford" cross-sections. The spectra simulated are, in fact, perfectly reasonable in general for the given conditions. The last two look exactly like I'd expect for mono-energetic RBS. The top ones are weird because of (1) odd scattering angles, and (2) the wide energy spread of the alphas. I believe the resolution requires better understanding of both RBS and SimNRA. $\endgroup$
    – Jon Custer
    Commented May 29, 2014 at 23:23
  • $\begingroup$ @JonCuster I don't know if the OP is still around, but you might post an answer of your own---it'll stand out more when future visitors drop by. It is certain that I was flailing around in a sea of ignorance. $\endgroup$ Commented May 29, 2014 at 23:26
  • $\begingroup$ @dmckee I appreciate the suggestion. On the other hand, the comment will show up in a search, and I don't think the answer I'd give is worth getting any credit for, certainly not at this point in the timeline. Not many folks do RBS anymore, certainly not compared with 20 years ago. My group still does, but it is pretty much a niche technique at this point. $\endgroup$
    – Jon Custer
    Commented May 29, 2014 at 23:40

Your Answer

By clicking “Post Your Answer”, you agree to our terms of service and acknowledge you have read our privacy policy.

Not the answer you're looking for? Browse other questions tagged or ask your own question.