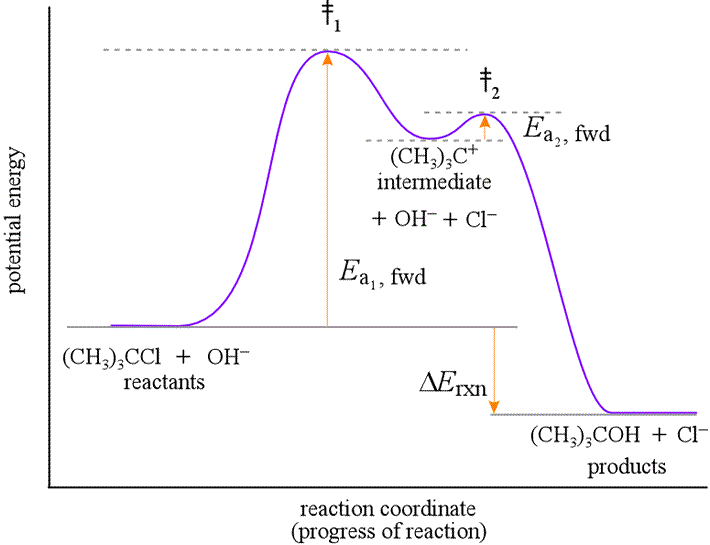
In chemical reactions one often considers so called "reaction coordinate" diagrams like this:
Is it possible to interpret the abstract "reaction coordinate" just as a simple time axis?
If so, are there any examples from simulations and measurements with quantitative (and not only qualitative) versions of such a diagram. I guess that the time scale should be about some femtoseconds, but I am not sure.
I already searched the web for this question but did only find an educational paper, where this is identified as a misconception
Additionally, being explicit that the energy diagram is a two dimensional depiction of the energy of the molecules as a function of the structure (Anslyn and Dougherty, 2006) and not time could possibly aid in conceptual conflict and encouragement of new schemata and possibly in conceptual change.
But I didn't find any further explanation why a parametrization by time is ruled out (also taking the quoted reference into account didn't help).
Edit
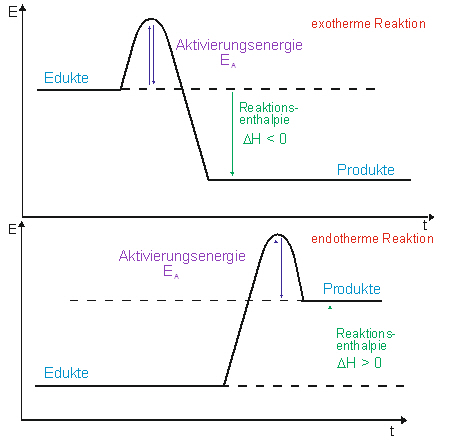
I have found several times a representation using time as axis in high school level representations. For example from this page from the ministry of education in Baden Württemberg (Germany):
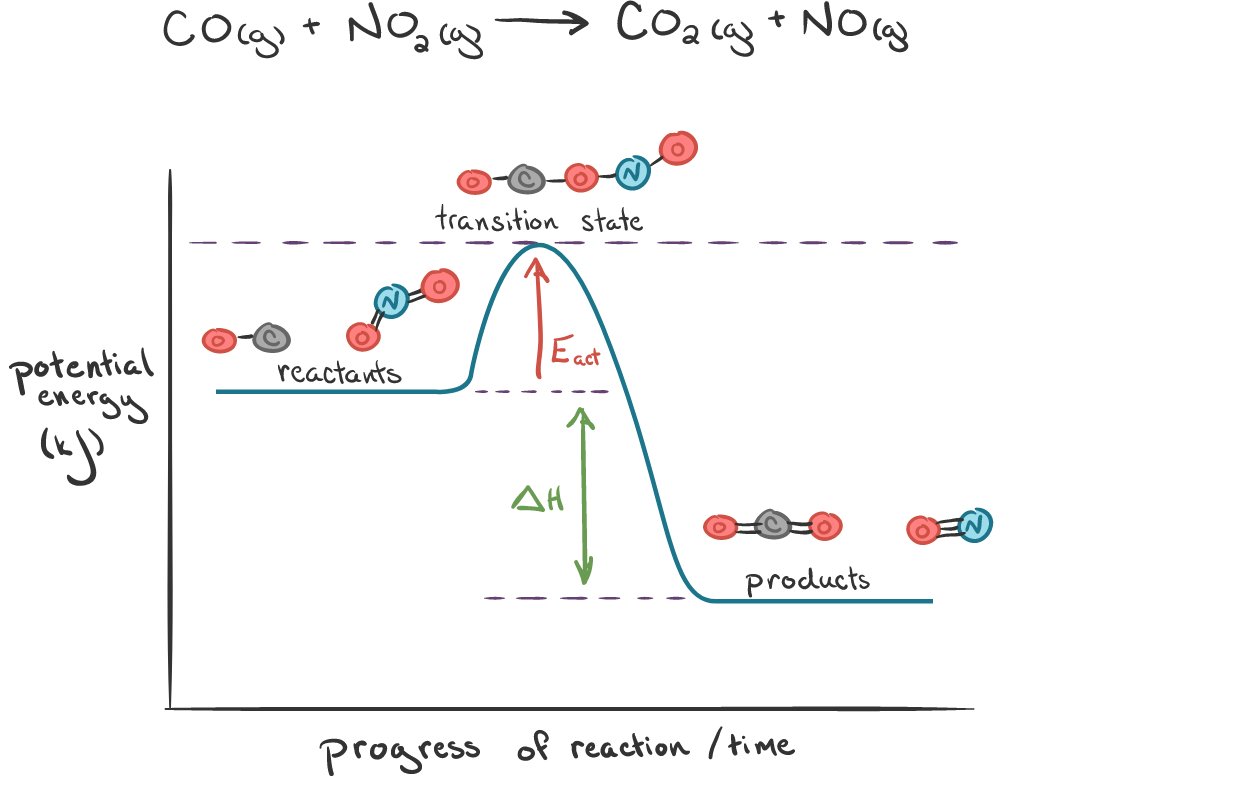
or from khanacademy:
Other examples are here, here (page 3, german "Reaktionszeit" means "reaction time")


