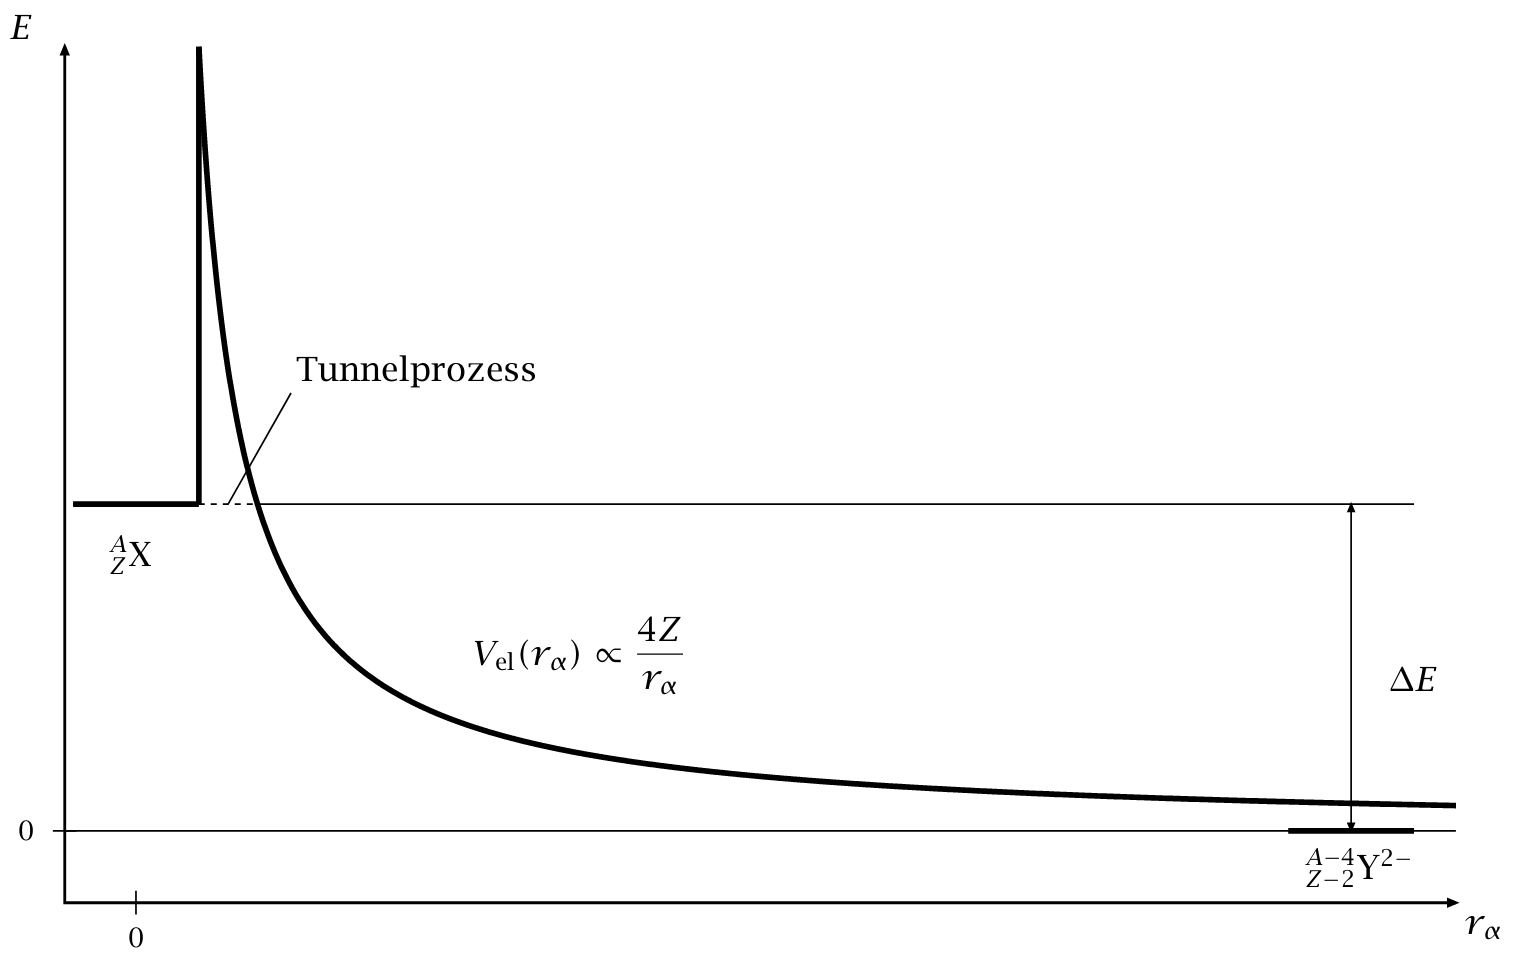
Interpreting the figure requires you to be thinking about the alpha particle as an independent entity moving around in (as part of) or near a nucleus.
The horizontal axis graphs the distance $r_\alpha$ between the particle and the rest of the nucleus (measured to the center).
The vertical axis graphs the energy $E$ "of" the alpha particle.0
The heavy line represents the potental energy of the alpha particle at various distances.1 The potential is made up of the electrostatic potential (with it's $1/r_\alpha$ dependence outside and slower variation inside), plus the effective nuclear force which is a strongly-negative and roughlty-constant value over a limited range but goes to zero quite suddenly. Classically this is the minimum energy the particle can have in any particular place. If the actual energy is higher than this the remainder will be kinetic energy.
By assumption the alpha starts in the nucleus (in the flat region near the horixontal axis) with energy $E_0$ that is lower than the peak value of the potential.2
Classically the alpha could never pass the peak.
But if you take this potential, assume a starting value of the wave-function confined to the nucleus and solve the time-dependant Schroedinger equation, you will find that the particle can escape. The quantum case is different from the classical one.
0 Strictly potential energies should be ascribed to the system as a whole, but we're treating the nucleus as a passive stage on which the alpha dances, so we use the same shortcut used in introductory physics and ascribe the potential to the mobile part of the system.
1 It should represent only the potential. It appears that this author of the figure has varied that meaning a little so that inside the nucleus it represents the ground-state energy (which is more than the pure potential by some amount). I don't like that.
2 In this figure $E_0$ is the upper thin horizontal line. It ought to be higher than the potential in the nucleus, but still lower than the peak. That's why I think the heavy lione is misdrawn.

