2
$\begingroup$

I am looking at photonic band diagrams specifically, but my question relates to band diagrams in general.

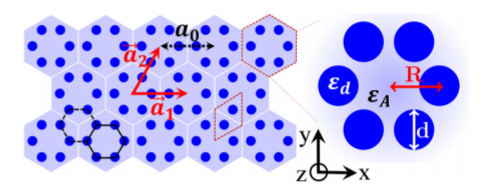
For a honeycomb lattice, I can pick a (primitive) rhombic unit cell or a hexagonal unit cell. This is the case for the Hu and Wu paper:

Rhombic and hexagonal unit cells outlined in red.

  1. If I have set up my rhombic unit cell such that it is the same geometry as my hexagonal unit cell and I sweep across the same ($k_x, k_y$) for my photonic band diagram, I should get the same photonic band diagram, right? (Just checking, I plotted it and got something different so I think I did something wrong).

The band diagram of the hexagonal unit cell looks like this (which looked fine when I reproduced this one):

enter image description here

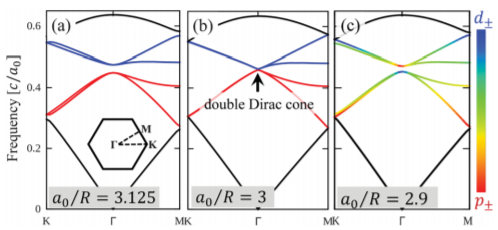
  1. If I use the correct reciprocal lattice vectors for my Brilouin zone sweep for each of the different unit cells, I should get different band diagrams (Eg in Hu and Wu paper where band crossing goes from K and K' points in rhombic graph to $\Gamma$ point in hexagonal graph due to Brillouin Zone folding). Can I derive or infer the photonic band diagram of the rhombic unit cell from the band diagram of the hexagonal unit cell?

A different example is in this paper where the unit cell is doubled: enter image description here
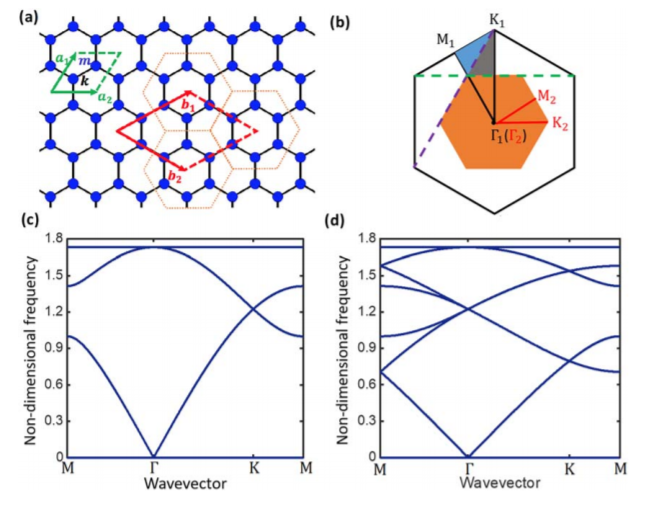
  1. The band diagram of the primitive unit cell is on the left and the doubled unit cell is on the right. The Brillouin zone for the doubled unit cell is half the Brillouin zone of the original, so is it just cutting the original band diagram in half and reflecting it (or is this horribly wrong)? So if a hexagonal unit cell is three rhombic unit cells... do I cut the photonic band diagrams in thirds or something?

This question looked similar but not sure how to apply that answer to the band diagram in Hu and Wu paper.

$\endgroup$

1 Answer 1

0
$\begingroup$

I recently encountered a similar phenomenon with body-centered cubic (BCC) and (simple cubic) SC lattices. I think what I figured out there could answer your first question.

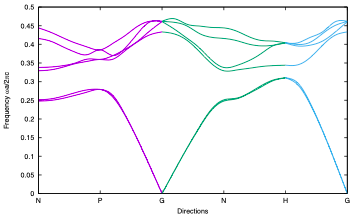
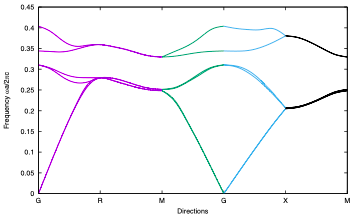
The figures below are photonic band diagrams of a same gyroid structure, each showing six bands. The 1st figure use BCC cell, direction sequence N-P-G-N-H-G (G for Gamma), reproducing Fig 6 in this review by Dolan et al. The 2nd figure use SC cell, direction sequence G-R-M-G-X-M, reproducing Fig 1a in this paper by Maldovan et al.

BCC cell SC cell

Not that there is a correspondence between the Brillouin zones of BCC and SC, namely P=R, N=M, H=2X. So after changing the cell, H folds onto G by a reflection in X. I have colored corresponding segments of the diagrams, which should facilitate the visualization of this folding. Onto the G-R segment of the 2nd figure is also folded a P-H segment from BCC, which is unfortunately not shown in the 1st figure. Also because of the folding, the 6 bands in the second figure correspond to the first 3 bands in the 1st figure, so one should not be surprised by the apparent difference in the "density" of bands.

I hope this helps you understanding Hexagonal lattice. The diagrams are expected to be different, but should be related in a similar way as I show here. I couldn't comment more without seeing your diagrams with the two choices of cells.

$\endgroup$

Your Answer

By clicking “Post Your Answer”, you agree to our terms of service and acknowledge you have read our privacy policy.

Not the answer you're looking for? Browse other questions tagged or ask your own question.