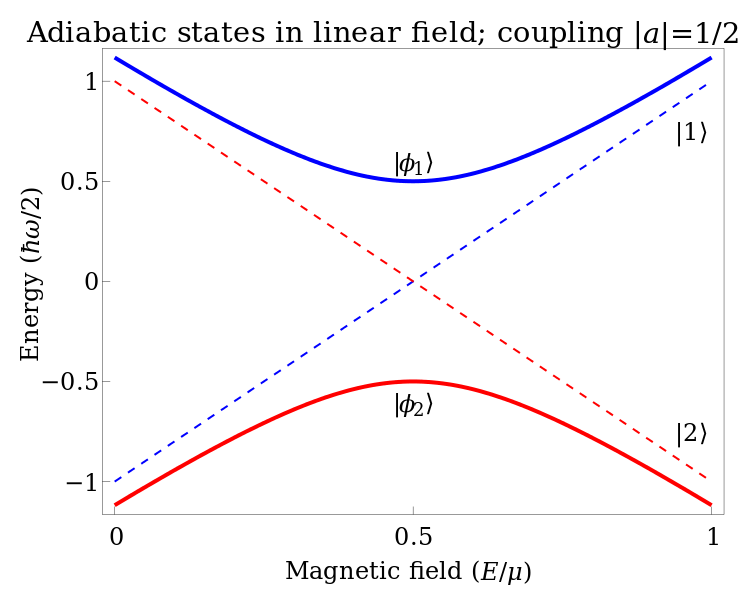
The shape of the graph you show applies to any 2-state system. This could be two potential wells containing a single particle that could be in either well, but it could also be a qubit with two states.
The two states are in this case named $\left|1\right>$ and $\left|2\right>$. The energy of the two states can be manipulated by changing some parameter. In your graph an increase in magnetic field increases the energy of one state while decreasing the other. This is depicted by the dashed lines. For two potential wells you could have a parameter that widens one of the potential wells and shrink the other one in such a way that for one potential well the energy of the ground state increases linearly while the energy of the other well's ground state decreases linearly.
If the two potential wells are far apart, the energy eigenstates of the total system will correspond to the eigenstates of the individual wells. The energy of these states is depicted by the dashed lines. However, if the wells are close enough, that the particles can tunnel from one well to the other, the two energy eigenstates of the total system become a superposition of the two original eigenstates. The states of the total system are $\left|\phi_1\right>$ and $\left|\phi_2\right>$. The energy of these states is depicted by the continuous lines.
The continuous curves show that if the parameter is chosen such that the state $\left|1\right>$ has a low energy and the particle happens to reside in this state, then by slowly changing the used parameter one can change the state of the system to $\left|2\right>$. For the wells, this corresponds to making the well with the particle smaller and the other wall bigger. This way the particle is forced to tunnel to the other well.
For other 2-state systems like for instance a qubit, there is often no tunneling occurring in the traditional sense. Still this process is sometimes described as tunneling from one state to another.
For more info see wiki pages on "avoided crossing" or "two-state-system"

