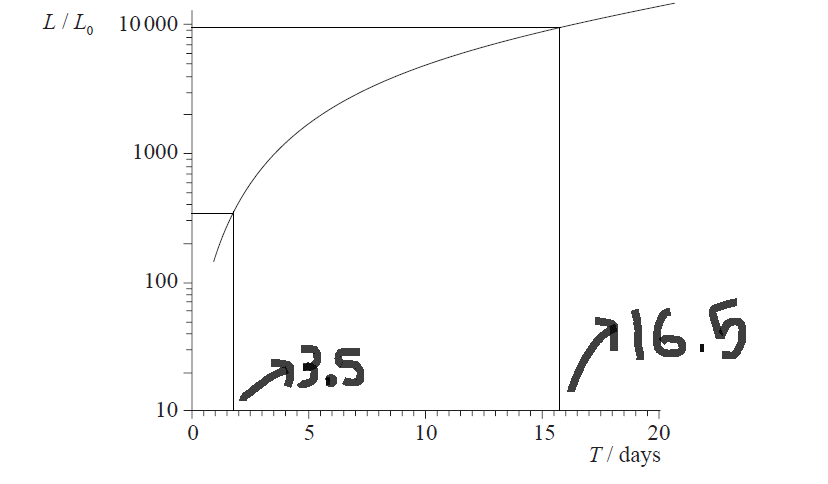
Just to give some background, the graph in the picture below shows the variation of Luminosity with the time period of Cepheid Variable Stars. In the expression $L/L_0$, $L_0$ is the Luminosity of the Sun. The time period of two stars is $3.5$ and $16.5$ days and through the graph one can obtain the Luminosities of these two stars for further computations. The Y-axis has a non-linear scale and I am having difficulty in reading it. Is it logarithmic?
-
2$\begingroup$ Using a logarithmic graph to represent data that isn't visibly linear or exponentially growing is a poor choice, as it is obviously being distorted, but it is unclear if the distortion comes from the fact that it is logarithmic or if the data grows similarly. $\endgroup$– NeilCommented Mar 11, 2016 at 15:38
-
1$\begingroup$ @Neil What scale would you use where you could read off y-axis numbers that are spread over two orders of magnitude with any kind of precision? Certainly not a linear one. $\endgroup$– ProfRobCommented Mar 11, 2016 at 17:30
2 Answers
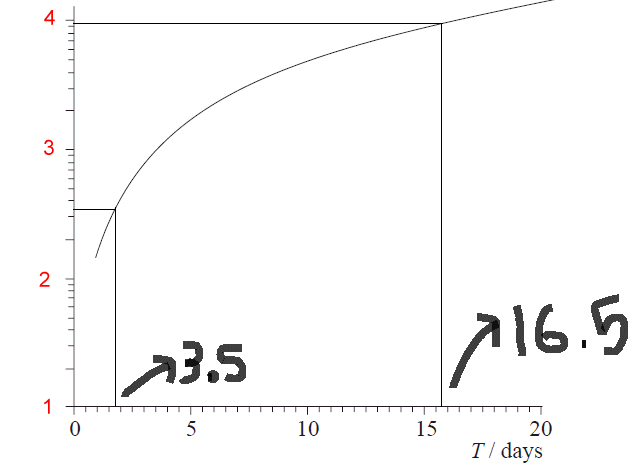
The $y$ axis is logarithmic so relabel it using $\log(L/L_0)$:
Now read off the value of $\log(L/L_0)$ using a ruler (ignore the tick marks on the axis). For example I estimate the first point is at $\log(L/L_0) \approx 2.53$ that is $L/L_0 \approx 341$.
-
$\begingroup$ maybe this image will make it more clear: i.imgur.com/Iy6RvdL.png?1 $\endgroup$ Commented Mar 11, 2016 at 16:45
The y-axis is logarithmic. The intermediate ticks are not spaced evenly, but they are constant increments away from each other. For example, above 100, you have 200, 300, 400, ... 900, 1000.
This is done because sometimes the shape of a non-logarithmic graph doesn't tell you much or is hard to read. In this case, though, it seems like it would still be readable, so the author might have chosen a log plot because it is conventional for the quantities being graphed.
-
1$\begingroup$ It is just a practicality. If you want one graph where you can read off numbers on the y-axis that might vary by two orders of magnitude then you are not going to use a linear scale. $\endgroup$– ProfRobCommented Mar 11, 2016 at 17:31


