What causes the melting point depression known as a eutectic point?
The temperature depression of a eutectic point can be calculated from the enthaplies and entropies of fusion of the two substances.
What causes the melting point depression known as a eutectic point?
The temperature depression of a eutectic point can be calculated from the enthaplies and entropies of fusion of the two substances.
A somewhat longer answer, since I'm afraid my comment may have seemed a bit abrupt...
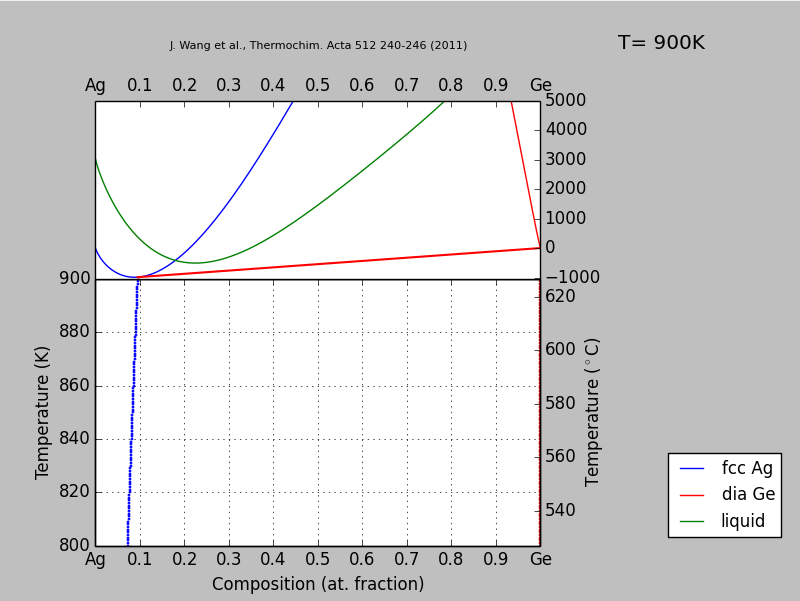
Lets look at a fairly simple thermodynamic system, the Ag-Ge binary phase diagram. This consists of 3 phases only, fcc Ag, diamond cubic Ge, and the liquid. Taking the published thermodynamic model from J. Wang et al. in Thermochimica Acta 512 240-246 (2011), one can calculate the free energy of each phase as a function of temperature and composition, and then extract the tie lines representing the lowest free energy for the system at each temperature.
 This figure shows, on the top graph, the free energies in the Ag-Ge system evaluated at 900K. The bottom graph is the calculated phase diagram up to that point. The blue line is the free energy of fcc Ag with Ge as a solute. The steep red line on the right is the free energy of diamond cubic Ge with Ag as a solute. The green line is the free energy of the Ag-Ge liquid phase. The one tie line that is present at this temperature is the nearly horizontal red line (OK, I should pick better colors). This is the common tangent between the fcc Ag(Ge) phase and the diamond Ge(Ag) phase. No other phase has a free energy below this line, so across this range the lowest free energy of the system is a mixture of fcc Ag(Ge) and diamond Ge(Ag).
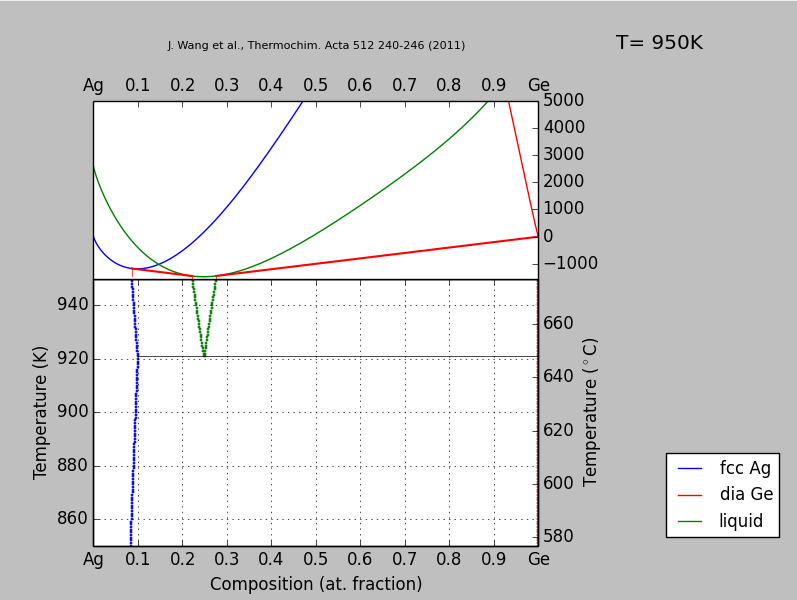
 Now we continued the calculation to show, in the upper graph, the calculated free energy curves at 950K. The liquid free energy has now dropped below the tie line between the two solid phases. Thus, the liquid is now a stable phase, and we have two tie lines. One connects the fcc Ag(Ge) phase with the liquid at one composition, and the other connects the diamond Ge(Ag) phase with the liquid at another composition. The liquid has now made an appearance on the phase diagram, with a eutectic occurring at ~921K and ~24 at.% Ge. Right at the eutectic point, the liquid free energy curve touches the tie line between the two solid phases.
A classic text on the thermodynamics of binary systems is Porter and Easterling, Phase Transitions in Metals and Alloys.