4
$\begingroup$

In the characterization of materials, there are many methods used: One of them is infrared spectroscopy. In a lab we saw the indices of refraction and absorption of a certain (semiconductor) solid material for some infrared frequencies.

I understand that we expect some absorptions because of the phonons' interaction and functional groups and I can see that clearly in the absorption index of the Lorentzian curve.

My question is: Both indices had the same morphology (as expected) but while the absorption index had that Lorentzian curve the refraction index had that kind of loop (for the same wavenumber region)

Why does the refractive index have that "loop" instead of a Lorentzian dip?
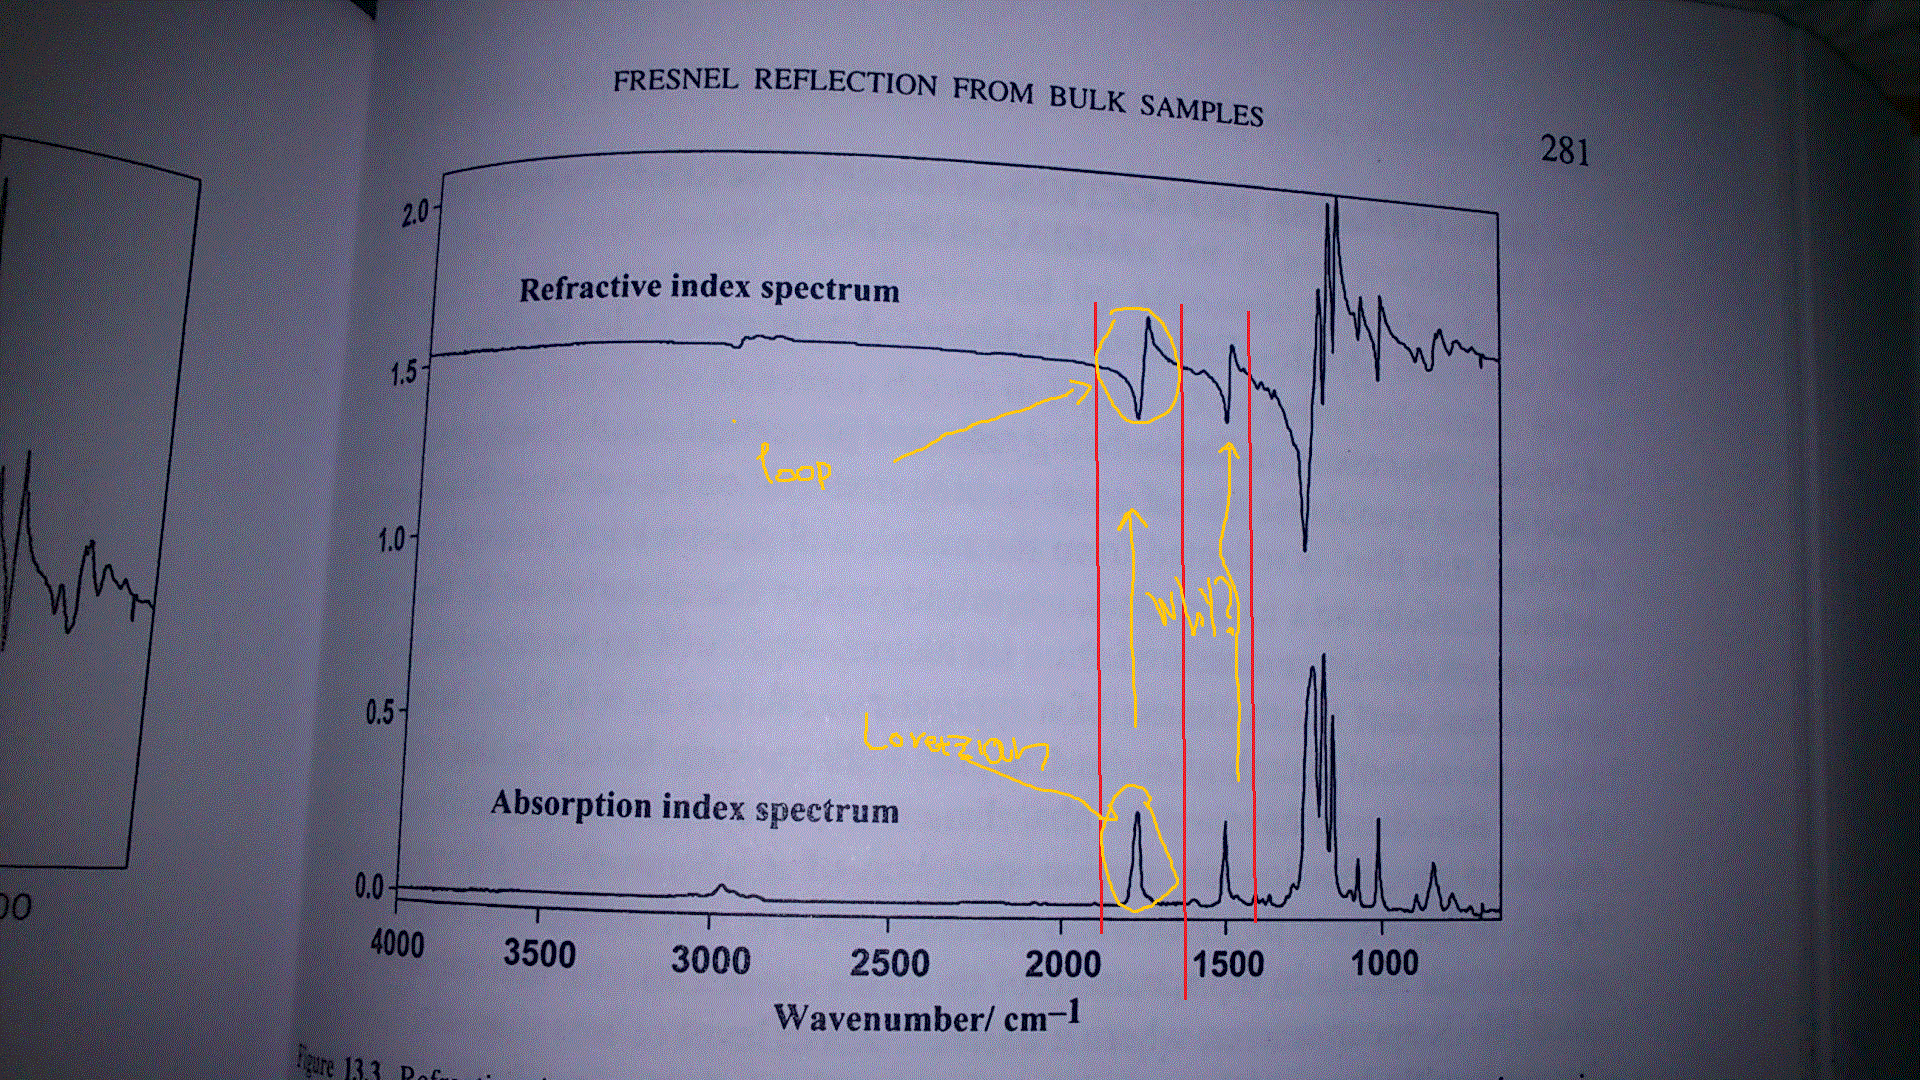
Picture for better understanding. taken from: Peter R. Griffiths and James A. de Haseth

$\endgroup$
4
  • 2
    $\begingroup$ Your "loop" is (mostly) the derivative of the absorption peak. $\endgroup$
    – user73762
    Commented Apr 11, 2015 at 12:37
  • $\begingroup$ @pyramids ok i can see that and i know the idea of the formula in mathematics but i can not understand the physical meaning. in absorbtion i can understand that the phonons absorve that region of wavenumbers and we get that pick. But in Reflection i can not unserstand that shape $\endgroup$
    – Antonis St
    Commented Apr 11, 2015 at 12:43
  • $\begingroup$ There is no reflection involved, unless you are talking about the reflection due to a change in refractive index between a surrounding medium (air?) and the material you are interested in. $\endgroup$
    – user73762
    Commented Apr 11, 2015 at 12:46
  • $\begingroup$ Maybe i have not been very specific and sorry for that: what we did was 2 different expirments one for Absorbtion that we hit the material with the infared beam. And one other that we collected the reflaction of the beam(from the material) . In the end we took the graphs (FTIR method) and basicly ended up like those in the picture. But mind that we took of the air of around the item. So as you said but with approximation of vacuum reftactive index. $\endgroup$
    – Antonis St
    Commented Apr 11, 2015 at 12:54

1 Answer 1

1
$\begingroup$

Absorption and refraction indices are the real and imaginary parts of the propagation constant for a medium. This means, given certain mild assumptions on the material's physics, they are the real and imaginary parts of a meromorphic (holomorphic with poles) function of the complex frequency that is holomorphic in the right half plane. They are therefore intimately related to one another through the Hilbert transform or the Kramers Kronig relationships.

The blips in the refractive index plots are actually the Hilbert transforms of the Lorentzian peaks in the absorption index plots. Indeed, I recommend working out and plotting the real and imaginary parts of the function:

$$f:\hat{\mathbb{C}}\to\hat{\mathbb{C}};\,f(z) = \frac{1}{z-z_0}-\frac{1}{z-z_0^*}$$

when $z_0,\,z_0^*$ are the the position of a pole in the left half plane when the complex frequency $z=i\,\omega$. You'll find the real part is the Lorentzian and the imaginary part has the same shape as the blips in the refractive index curves.

$\endgroup$
1
  • $\begingroup$ Thank you so much. I believe i have seen that kind of analysis using Principal value etc.... but i want to ask now what is its physical meaning in the expirment that i describe above and in the comments. $\endgroup$
    – Antonis St
    Commented Apr 11, 2015 at 13:57

Your Answer

By clicking “Post Your Answer”, you agree to our terms of service and acknowledge you have read our privacy policy.

Not the answer you're looking for? Browse other questions tagged or ask your own question.