9
$\begingroup$

Have a look at the following diagram:
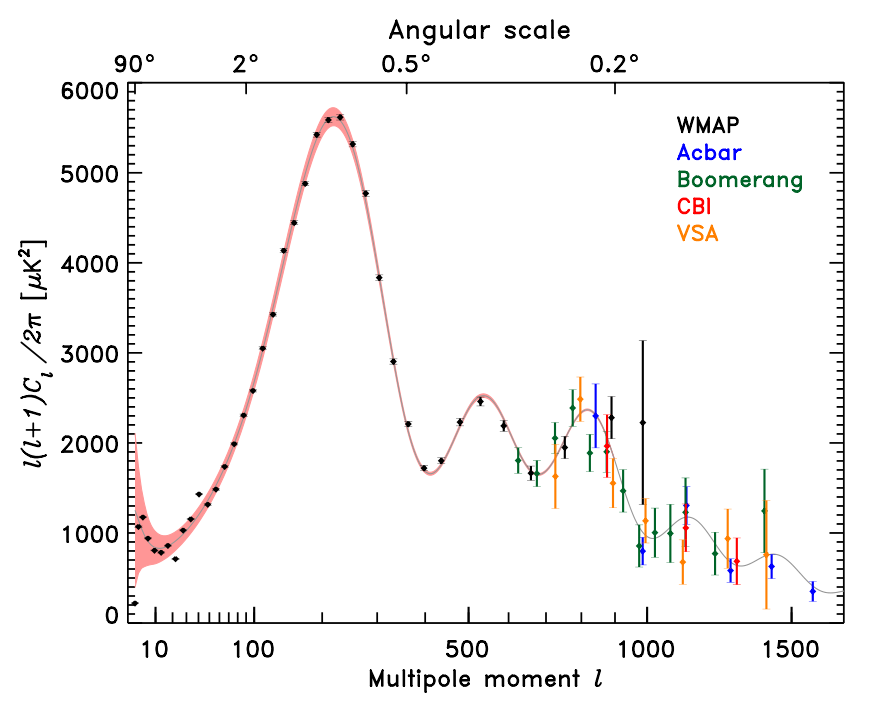
CMB measurements

This shows measurements of the CMB by various experiments, with multipole moment $l$ on the x-axis and the temperature of the corresponding moment on the y-axis. (Please correct me if I have that wrong.)

Looking at the plot, I can see that WMAP's results extend to about $l=1000$, and they become poor as we go to higher values of $l$. Meanwhile, the other experiments can't measure the CMB at lower values of $l$ around $l < 500$. I'm guessing that a ground-based approach with a large collector is required to get the high resolutions needed to measure the power of the component at high values of $l$. Is this correct?

What I don't understand is, why can't the other experiments get measurements in the lower part of the plot?

$\endgroup$

1 Answer 1

3
$\begingroup$

What I don't understand is, why can't the other experiments get measurements in the lower part of the plot?

Firstly, you are assuming that graph shows all the data from all the listed experiments.

Secondly, the full sky needs to be observed to obtain data for very small multipole moments.

As can be seen in the case of the Boomerang data, both of the above reasons apply.

The data do go down to multipole moments much lower than in the plot of the question, and only 1% of the sky was observed.

In the case of ACBAR, as the name Arcminute Cosmology Bolometer Array Receiver implies, the experiment was designed to obtain very high spacial resolution from small patches of the sky. But again, the plot in the question does not show the full range of the ACBAR data, which is from about l=450 to l=2500.

$\endgroup$
2
  • $\begingroup$ Thanks! By the way, why are the units on the y-axis $μK^2$? $\endgroup$
    – Brian
    Commented May 12, 2014 at 16:39
  • 2
    $\begingroup$ @Brain because the dependent variable is a function of the square of temperature difference. See the following reference, especially equation 6 for a detailed explanation: roe.ac.uk/ifa/postgrad/pedagogy/2006_tojeiro.pdf $\endgroup$
    – DavePhD
    Commented May 12, 2014 at 16:49

Your Answer

By clicking “Post Your Answer”, you agree to our terms of service and acknowledge you have read our privacy policy.

Not the answer you're looking for? Browse other questions tagged or ask your own question.