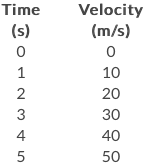
Let's take a look just from the point of view of someone reading the problem.
First of all, we can say "our car has motion", because it's changing its position each second.
Ok. So, how is its motion?
Well, it is moving in 1 dimention, it is a linear movement. Then, we can say "our car has linear motion".
Also, we can see our car's velocity is changing every second. Then, we can say "our car has linear motion, and has acceleration".
Ok. So, how is its acceleration?
Well, we can see from the chart that, in this particular case, it's velocity is changing constantly. This is interesting and very important. To make a deduction from this, we need to remember how acceleration is defined:
Acceleration is defined as the rate of change of velocity with respect to time.
For those of you with knowledge of calculus, you can take this definiton as:
Acceleration is the second derivative of displacement.
But you don't need to know calculus to see that a constant change of velocity is equivalent to a constant acceleration.
Now we can say "our car has uniformly accelerated linear motion" that also means "our car has linear motion, and has a constant acceleration".
Knowing we have a constant acceleration, in order to understand what is going on, we only need 2 more things. Initial conditions, and the exact value of the acceleration.
For initial conditions you can see from the picture that at the start, time $t=0 s$, the car is where we call "0 m", or $x=0 m$. From the chart, we can read that the car has a velocity $v=0 m/s$.
So our initial conditions are:
$$t=0 s$$
$$x=0 m$$
$$v=0 m/s$$
And finally, we can see each that each second the velocity increases $10 m/s$. In other words, our acceleration $a$ must be $10 m/s^2$.
Now that we have worked out the situation to the point we know everything from our problem, let's introduce your question.
What should be the velocity of the car in $t=1s$?
Going back to our definitions, if the topic of your webpage is "Meaning of Slope for a v-t graph", you must be interested in how to find out the velocity at a certain step of time.
The graph of the v-t from your car is a straight line that goes from $(t=0,v=0)$ to $(t=5,v=50)$. The slope from this graph has the same meaning as the acceleration:
The slope is defined as the rate of change of the dependent variable (velocity) with respect to the independent variable (time).
If we call $m$ the slope from the graph, by definition it should be calculated:
$$m = \frac{\Delta v}{\Delta t} = \frac{v_{j} - v_{i}}{t_{j} - t_{i}}$$
Good for any integer $i,j\leq 6$, as long as $i<j$.
For this particular case, and for any pair of data we choose, we will find:
$$m = \frac{1-0}{1-0} = \frac{10}{1} = 10$$
or, by definition of our variables:
$$a = 10 m/s^2$$.
When analyzing graphs, the area under the curve can be understood as "the integration", in this case, you can say that the area under the curve (a straight line in here) is the value of your distance, as it is the integration of your velocity through the time it has been increasing, so, as our graph draws a triangle:
$$x_{final}=\frac{(v_{i} - v_{initial})(t_{i} - t_{initial})}{2}$$
In particular:
$$x_{t=1}=\frac{(v_{t=1} - v_{initial})(1s - 0s)}{2} = \frac{(10 m/s - 0m/s)(1s)}{2}$$
$$x_{t=1}= 5 m$$
The same principle, but in a common formula that you can you without drawing the graph is:
$$x_{final}=x_{initial}+v_{initial}t+\frac{1}{2}at^2$$
$$x_{t=1}=x_{initial}+(v_{initial})(1s)+\frac{1}{2}a(1s)^2$$
$$x_{t=1}=0m+(0m/s)(1s)+\frac{1}{2}(10m/s^2)(1s^2)= \frac{1}{2}(10m)$$
$$x_{t=1}= 5 m$$
Both methods give the same result. What is messing with your thoughts are just common mistakes of interpretation of how uniformly accelerated motion works.
I hope to clear your questions.


