1
$\begingroup$

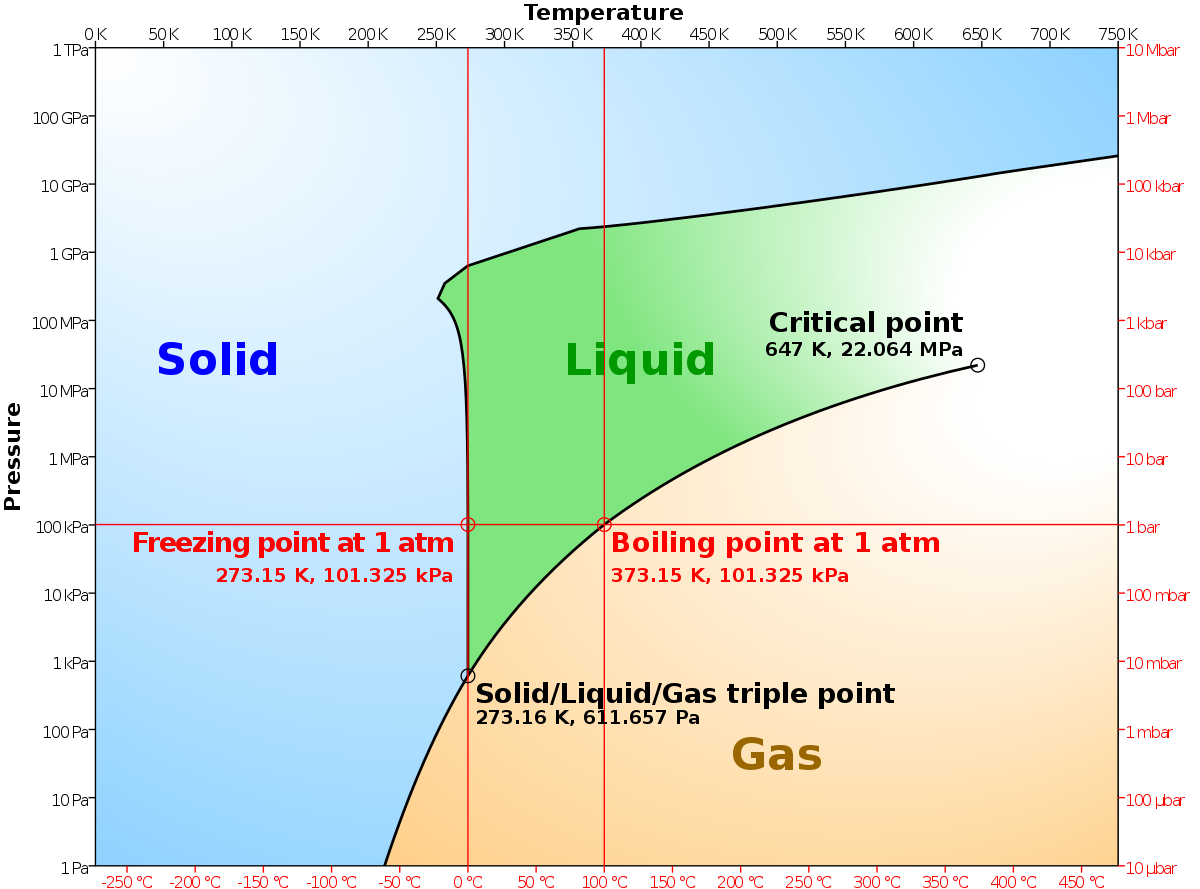
This phase diagram of water shows how the phase of water is determined by the pressure and temperature.

enter image description here

I find it easy enough to understand; as the pressure increases, the boiling point of water also increases and thus water can stay liquid even if the temperature is higher than $100 °C$.

Additionally, the freezing point of water stays roughly at $0 °C$ until it starts decreasing around when the pressure is $100 \text{MPa}$. This means that water can be liquid a few degrees below Celsius at those pressures.

But this trend reverses and at higher pressures, the freezing points increases above $0 °C$ and seems to stay that way.

Why? What causes this regression of the freezing point of water at those specific pressures, and why does it change course at even higher pressures?

$\endgroup$

1 Answer 1

1
$\begingroup$

A more complete phase diagram indicates that ice—like many crystalline solids—has multiple phases, each with its own lattice arrangement:

phase diagram for water

Ice-1h is anomalous in that it's less dense than the liquid state. Relative to the liquid state, it's evidently not well packed at the molecular scale. (As discussed in the link, liquid water gets a density boost from hydrogen bonding.) The other phases moving up the phase boundary line are more typical in that they're much more tightly packed than the liquid state; pressurization thus favors their formation, as pressurization always favors the higher-density phase.

$\endgroup$

Your Answer

By clicking “Post Your Answer”, you agree to our terms of service and acknowledge you have read our privacy policy.

Not the answer you're looking for? Browse other questions tagged or ask your own question.