0
$\begingroup$

I am attempting to plot the natural log of a set of values against another set of data on the x-axis in Python.Plot of ln(\alpha) against energy in eV.
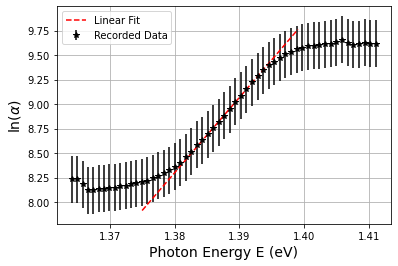
However when I code the error propagation, as the error for $\ln(\alpha)$ is given by the error in $\alpha$ over its value, then the error on the y-axis will always be the same as shown in the 2D plot. This is not how I expected my data to look if I am being honest. Should I include my error propagation in Python? If so can someone let me know if this still belongs on this site and not the coding version of this site.

$\endgroup$
1
  • $\begingroup$ I’m voting to close this question because it belongs to the Computational Science site. $\endgroup$
    – Miyase
    Commented Apr 10, 2023 at 8:20

1 Answer 1

1
$\begingroup$

For small uncertainties, we use

\begin{align} \ln(x±\Delta) &= \ln x+ \ln(1± \delta) \\& ≈(\ln x) ±\delta \end{align}

Here $\Delta$ is the absolute uncertainty, with the same units as $x$, while $\delta=\Delta/x$ is the dimensionless fractional uncertainty. For example, if $x= 9 \text{ unit}$ has a fractional uncertainty of $\delta=1\%$, we would say that the logarithm of $(9\pm 0.09)\text{ unit}$ is the dimensionless result $(2\pm 0.01)$. At least, in the approximation where $9=e^2$, so that I don't need to grab a calculator for some irrelevant digits, and where we sweep the problem of dimensionful logarithms under the rug.

The thing to notice here is that the fractional uncertainty on the variable becomes the absolute uncertainty on its logarithm.

Your error bars all seem to be about $\pm 0.25$, suggesting you have assumed a uniform 25% uncertainty on each of your $\alpha$. That's unusually large, and the variations in your points suggest it is too large — perhaps just a typo.

$\endgroup$

Your Answer

By clicking “Post Your Answer”, you agree to our terms of service and acknowledge you have read our privacy policy.

Not the answer you're looking for? Browse other questions tagged or ask your own question.