0
$\begingroup$

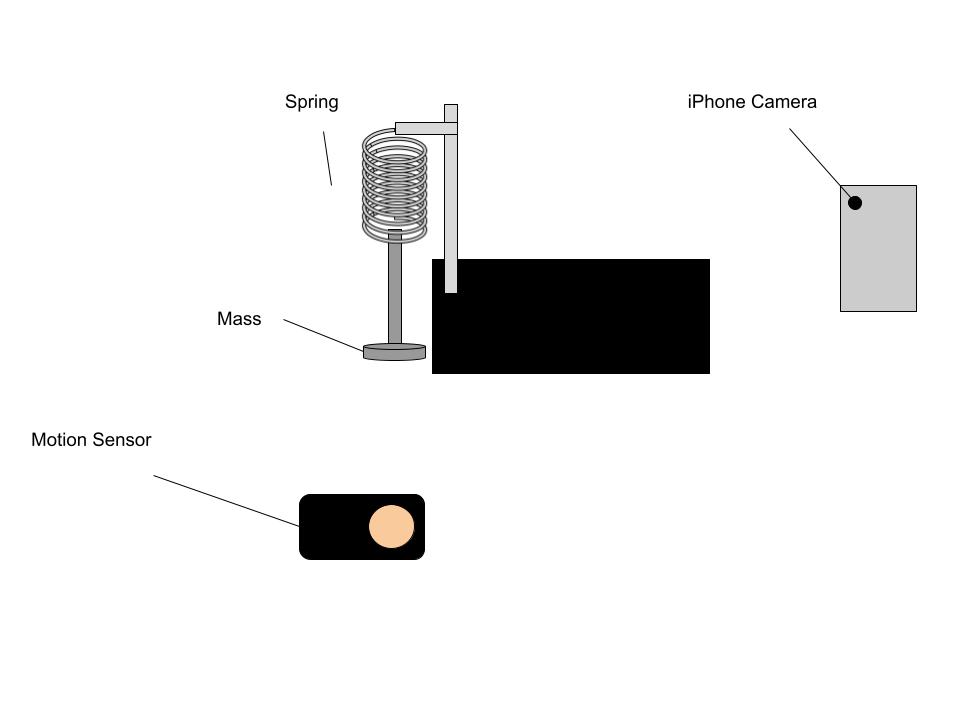
In a physics experiment, we attempted to measure the kinetic, gravitational, and elastic energy of a mass on a spring (in order to illustrate conservation of energy). We measured the height of the mass via 1) A high-frame-rate video recording and 2) using sound waves, via a Vernier Go! Motion encoder.

Diagram, showing spring, mass, camera, and sensor

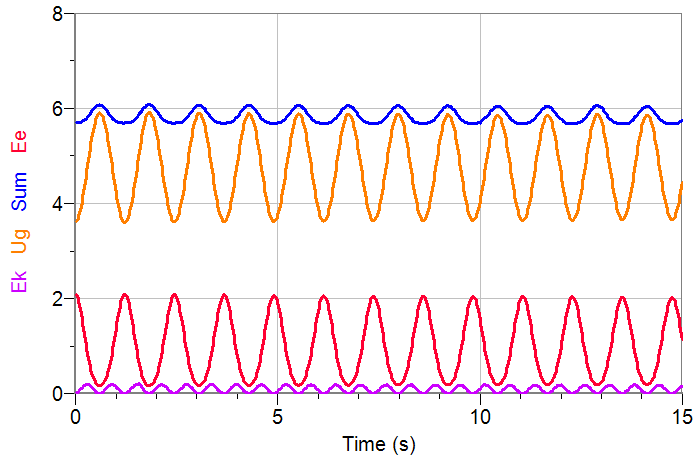
However, with both methods, our total amount of energy fluctuates over time, having the greatest amount of energy when the system is at the top of its cycle, and minimum when it is at the bottom (near the ground). Graph showing energy changes over time
Here's a summary of the applicable calculations. For some quick definitions...

  • m is 0.94kg, the mass attached to the spring
  • h is the current height of the mass above the ground
  • v is the velocity, calculated using the derivative of h with respect to time
  • g is assumed to be 9.8
  • k is 34.162, measured via the spring
  • x is the amount the spring is stretched, calculated by subtracting the current height, h, from the initial height (~0.74 m)

Calculated values:

  • Kinetic energy (Ek) - 1/2 * m * v^2
  • Gravitational energy (Ug) - m * g * h
  • Elastic energy (Ee) - 1/2 * k * x^2
  • Total energy (sum) - Obviously, simply the sum of all three types of energy.

We would think that the energy should be relatively constant (if not decreasing, due to thermal losses); however, energy instead stays relatively constant over time (at the peaks), but fluctuates throughout the cycle. If anyone has any ideas of what might be causing these strange oscillations, let me know!

$\endgroup$
3
  • $\begingroup$ How are you calculating the derivative $v$? Doing so with measured data introduces errors, without appropriate smoothing and interpolating functions. $\endgroup$
    – jalex
    Commented Oct 17, 2022 at 21:47
  • 1
    $\begingroup$ Another source of error might be deformations on the spring base, as the spring extension might not correlate to the target position 100%. In addition, the spring rate might have some non-linearity or hysteresis. There are a lot of assumptions that go into something like this, and finding only a <5% total error would be a win for me. $\endgroup$
    – jalex
    Commented Oct 17, 2022 at 21:49
  • $\begingroup$ Have you considered the kinetic energy and gravitational potential energy contributions of the mass of the spring? . $\endgroup$
    – DJohnM
    Commented Oct 18, 2022 at 22:25

3 Answers 3

0
$\begingroup$

Either you've discovered a violation of the conservation of energy, or some of your parameters are wrong.

$g=9.8{\,\rm m/s^2}$ is certainly wrong. You can figure out your gravity anomaly (https://en.wikipedia.org/wiki/Gravity_anomaly) based on your lat/lon. How sensitive is the experiment to $g$?

How well do you know the mass? What is the sensitivity to mass errors?

And the $k$. How was this measured? Is it even linear? Perhaps:

$$ F = k(x - \frac 1 2 \alpha x)$$

So plot the "missing energy" (or excess energy) vs $x$ and $v$. Vary $g$, $m$, $k$, $\alpha$ until it's constant and zero.

Assuming that works: Do the fitted $g$, $m$, $k$ & $\alpha$ make sense? What are the errors and covariance?

You might want to have a chi-squared, which will require error bars on your measured data. If you don't know them, just do the fit and pick an error bar that makes chi-squared per degree of freedom equal to one.

$\endgroup$
1
  • $\begingroup$ We did try looking at different values of g, and I'm not sure it's that sensitive for the experiment. But you make a good point that there are other things to look at. Those are some good methods to look at error, so thank you! We'll look at doing some more statistical analysis. $\endgroup$
    – Catogram
    Commented Oct 18, 2022 at 17:09
0
$\begingroup$

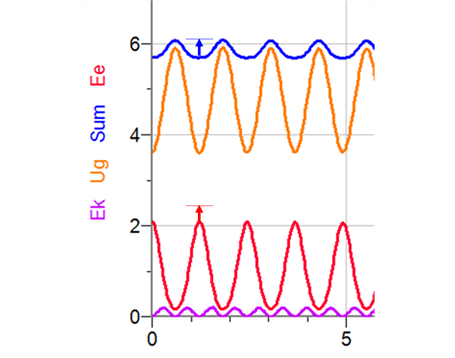
Just looking at the graph I can make the case that is the spring potential energy that is suspect

fig1

First notice that the fluctuation goes at 1× rate like the displacement $x$, and not at the 2× rate of speed $v$.

Then you take the deficit of energy (blue arrow) and transpose it down to find the deficit in potential energy (red arrow).

You can run the reverse calculation and find the stiffness $k$ needed to cover the deficit at the peak and then you can see if really the error is due to the measured stiffness vs. the actual stiffnes.

$\endgroup$
1
  • $\begingroup$ Thanks, that is also an excellent answer! We'll look at using k to find a potential error, as well. You also make a good point that the fluctuations realistically aren't that big now. With some previous trials we were measuring > 20% errors, so this is much better (and probably acceptable). $\endgroup$
    – Catogram
    Commented Oct 18, 2022 at 17:10
0
$\begingroup$

Overall if I had done the experiment I would be very please with the results which you obtained.

Some points.

Taking $g = 9.8\,\rm m\,s^{-2}$ instead of a more precise local vale, eg $g = 9.81\,\rm m\,s^{-2}$, will make no significant difference to your analysis as it represents an error of about $0.1\%$.

We would think that the energy should be relatively constant (if not decreasing, due to thermal losses) . . ., some of the mechanism of loss will be due to air resistance and it is present as can be seen even with the pixelated graphs that you have presented in these enlarged sections of the spring energy around one and fifteen seconds.

enter image description here

The small decrement is no so surprising given that the mass is fairly large and it is not moving very fast.

For an ideal spring the period $T = \sqrt{m/k}$ which your values for the mass and the spring constant gives a period of $1.04\,\rm s$ which is significantly smaller than the measured (from you graph) value of $1.23\,\rm s$.
A correction which could be made is no note that the spring is not massless and the period is then given by $T = \sqrt{m+m^*)/k}$ where $m^*$ is called the effective mass of the spring and is about a third of the mass of the spring.
Using the actual value of the period and your spring constant gives a value for the effective mass of $0.37\,\rm kg$ and an actual mass of just over one kilogramme which perhaps is not so?!
So perhaps you need to consider that there might be an error in the spring constant, the fact that the spring does have a mass and this may well have an effect on the kinetic energy of the system and perhaps a different effect on the gravitational potential energy of the system.

Looking at the elastic energy graphs and reading off the maximum $(0.346\,\rm J)$ and minimum $(0.148\,\rm J)$ energy values and using your value of the spring constant gives extension values of $0.35\,\rm m$ and $0.10\,\rm m$ and a mean extension of $0.25\,\rm m$.
How do these values tally with the maximum $(0.64\,\rm m$ and minimum $(0.39\,\rm m)$ heights used for the gravitational potential energy plot? Is the ~$0.74 \,\rm m$ the height from which the mass was initially dropped?

Because there is such a large difference between the theoretical and actual period of the system I would remeasure the spring constant but not from zero extension.
Add a mass making sure the coils are separated and measure the position of the mass and then add another mass and measure the position of the two masses and repeat as necessary to find the spring constant.

$\endgroup$

Your Answer

By clicking “Post Your Answer”, you agree to our terms of service and acknowledge you have read our privacy policy.

Not the answer you're looking for? Browse other questions tagged or ask your own question.