4
$\begingroup$

We have seen that the orbits of the planets around the sun can be found, to a good approximation, by only considering a two-body system (a planet and the sun) interacting through a central force. However, all the other planets cause slight variations in the predicted path of an individual planet. Astronomers have been able to calculate the expected precession of Mercury’s apsides (due to the forces of other planets) to be 531 arcseconds per century, and they have observed that the actual precession is 574 arcseconds per century. This leaves a difference of 43" that could not be explained by uncertainties in calculation or measurement and which was noticed as early as 1845.

Source: https://www.tau.ac.il/~morris/03411203/chapter3/mercury_paper.pdf

As we can see from the quote above that the precession of mercury had been calculated to an amazing degree of accuracy well before Einstein's theory of general relativity. To account for the difference between the calculated value and the one predicted by Newton's theory, they came up with mistaken ideas of Vulcan and dust clouds. It was Einstein's theory which gave a final answer. The orbits of all other planets also precess but the value is too small and astronomers in the past didn't notice it for other planets other than Mercury.

Perihelion is the closest point to the sun while the aphelion is the farthest for any orbit.

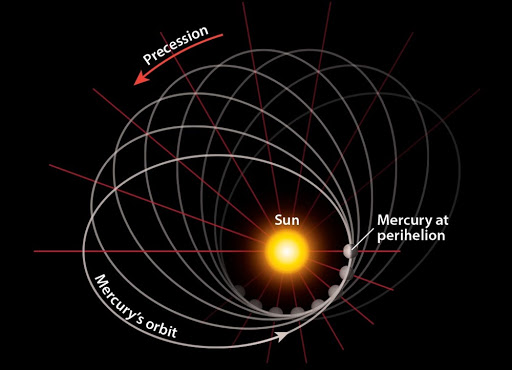
My question is about the Newtonian precession of 531 arcseconds per century. Suppose, we are looking at the picture shown below from above the solar system. It could be assumed that all the planets lie in same plane. Looking from the top, one would say that precession is taking place counterclockwise as if some force is gradually pulling the entire orbit of planet Mercury in counterclockwise direction.

enter image description here

Source: https://www.astronomicalreturns.com/2020/05/the-mystery-of-mercurys-missing.html

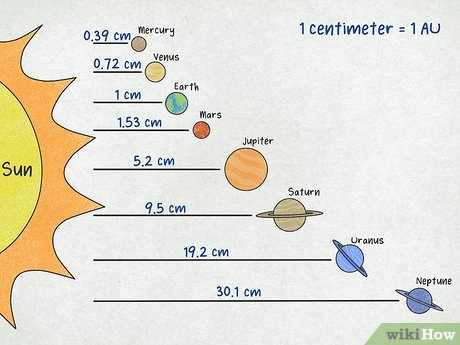
The Newtonian precession of 531 arcseconds per century was the result of gravitational attraction of other planets onto Mercury. The picture below shows the relative sizes of the planets and their distance from the sun. I think that Mercury should be affected most by Venus, Earth, Mars, and Jupiter since these planets are relatively close to Mercury's orbit. Mercury takes almost 88 days to orbit the sun.

enter image description here

Source: https://www.wikihow.com/Draw-the-Solar-System

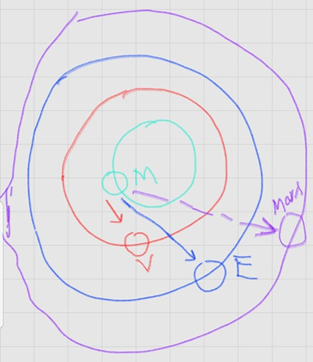
As I said earlier, it appears as if Mercury's orbit is being pulled in counterclockwise direction which suggests, at least to me, that mostly other planets were in such a configuration that their resultant pull onto Mercury was in the counterclockwise direction. If it was not true then there would be times when Mercury's orbit could precess or slide in clockwise direction as well. The diagram below is a crude attempt to show you how I'm thinking. The orbit in cyan is for Mercury, the orbit in red is for Venus, and so on. The arrows show the pull of shown planets onto Mercury.

Could you please let me know if I'm thinking along the right lines? I'm trying to understand it intuitively.

enter image description here

$\endgroup$

1 Answer 1

10
$\begingroup$

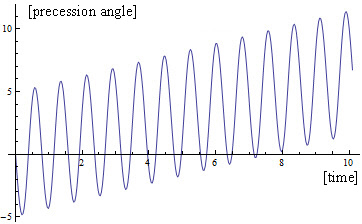
You are essentially correct to assume that the precession is sometimes backwards as well. The frequently quoted value of 531"/cy is only the long term net average. In reality there is a considerable oscillatory component added to this, as illustrated in the following schematic figure

precession of perihelion

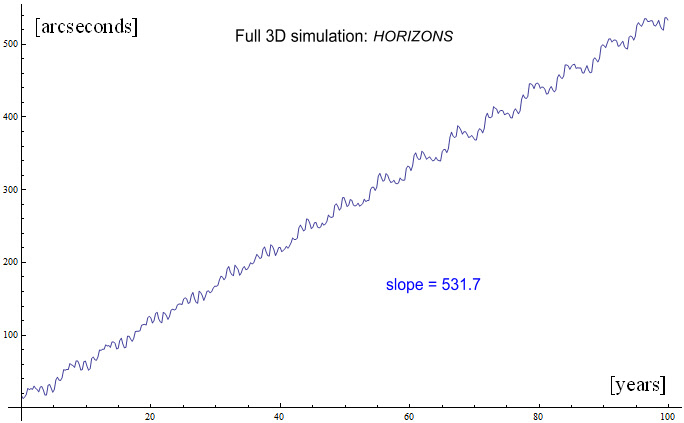
The oscillation period here is essentially the orbital period of the disturbing planet. The effect is exaggerated here just to demonstrate it. If you do the same calculation with the actual data for all planets, you get the following graph for Mercury's Newtonian perihelion precession

Mercury Perihelion precession

Although the increase of the perihelion angle is now closer to a linear increase, there is still a considerable wobble, and at times it is going backwards for a few years. The two main periods in the oscillation visible here are those of Jupiter and Venus, which have the largest impact on the precession (Jupiter due to its mass and Venus due to its proximity)

For more details see the web page Mercury's Perihelion Advance from which also the above figures were taken


EDIT: Let me add a qualitative explanation of what is happening here:

an outer planet in opposition to Mercury (i.e. on the same side of the Sun) will result in a small force pulling it away from the Sun. So if Mercury is moving away from the Sun again after its closest approach (perihelion) the gravitational force of the Sun will effectively be reduced slightly and it takes longer to bring the radial velocity back to zero again. This means Mercury will go slightly further in its orbit until it has reached its furthest point (aphelion) i.e. a positive precession. If however the disturbing planet is on the opposite side of the Sun, its gravitational field will effectively increase the gravitational field of the Sun, so the effect will be the other way around, leading to a negative (backwards) precession. In the latter case the planet is further away though than in opposition, so the effect is smaller, leaving an overall positive (forward) precession on average. The net result can therefore be seen as an oscillatory precession angle (related to the time dependent orbital motion of the disturbing planet) superposed on a linearly increasing precession angle related to the time averaged mass distribution of the planet (which is effectively a circle/ellipse and thus always produces an outward directed force i.e. a positive precession)

$\endgroup$
13
  • 1
    $\begingroup$ @PG1995 Yes, I saw and read this other answer as well. It must have been removed by the author. $\endgroup$
    – Thomas
    Commented Feb 27, 2022 at 8:44
  • 1
    $\begingroup$ Could you put units on the graphs? It was my answer that I have deleted since it was incorrect in the sense that I did not think the perturbations could reverse in sign, even instantaneously. $\endgroup$
    – ProfRob
    Commented Feb 28, 2022 at 5:59
  • 1
    $\begingroup$ @PG1995 Q1: The curves are strictly speaking not continuous. They consist of points showing the location of the perihelion angle. Each point contains the integrated effect of a whole Mercury orbit, so by definition the orbit wobble of Mercury is averaged out here already $\endgroup$
    – Thomas
    Commented Feb 28, 2022 at 21:32
  • 1
    $\begingroup$ @PG1995 Q2: No, it is the other way around. The precession is faster for planets closer to the sun i.e. planets that are faster (see also the link to that website I gave in my answer, where the effect of changing planet velocity is shown) $\endgroup$
    – Thomas
    Commented Feb 28, 2022 at 21:37
  • 1
    $\begingroup$ @PG1995 You would be correct with regard to Q1 if you would track Mercury's orbit continuously. As it is, only the position at perihelion is tracked, so that averages over the wobb;le of Mercury's orbit and you won't see it in this plot. You only see the wobble due to the disturbing planets, even if you zoom in closely As for Q2, you are right, the webpage is referring to the disturbing planet, but the precessing orbit definitely precesses faster for closer orbits (i,.e. higher velocities) as well, evem much more so than for the disturbing planet. $\endgroup$
    – Thomas
    Commented Mar 1, 2022 at 8:28

Your Answer

By clicking “Post Your Answer”, you agree to our terms of service and acknowledge you have read our privacy policy.

Not the answer you're looking for? Browse other questions tagged or ask your own question.